
Figure 4.
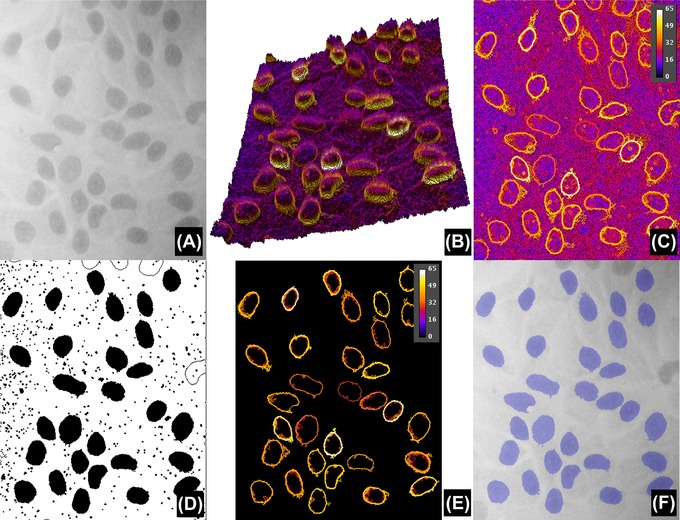
Comparison of results obtained without and with object specification. (A) Version of Figure 1(A) modified to simulate uneven background illumination. (B) Pseudo‐3D projection of the stack S, without object specification (the z axis inverted for clarity purposes, with high L at the bottom). The labelling colour is G Average (L, c) and the tilted slope is due to the difference in local intensity of the image. Compare (B) with Figure 3(C). (C) Maximum projection P of stack S, whereas (D) is the result after applying the regional maxima and region filling. Note that (C) is very similar to Figure 3(D), in the sense that it recovers a simplified version of the gradients even under uneven backgrounds. (E) Maximum projection P of stack S, but this time after applying object specification while constructing S (in this example, boundaries are only retained if regions have a circularity of at least 0.5 and sizes between 250 and 3000 pixels squared). This results in an even more simplified version of P that after the regional maxima and binary filling detects all nuclei in the image (overlay in blue in F).