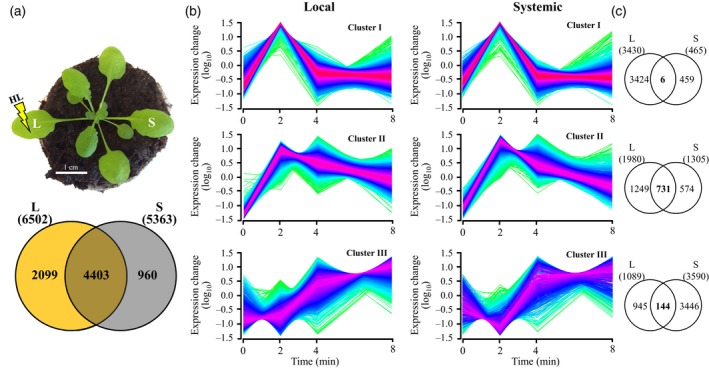
Figure 4.

Transcriptomic responses of local (L) and systemic (S) leaves of rbohD plants to local application of excess light stress. (a) The experimental design used (top) and a Venn diagram showing the overlap between local and systemic responses to light stress (bottom). (b) Distinct clusters of transcript expression in local and systemic leaves of rbohD plants in response to local application of light stress. (c) Venn diagrams showing the overlap between the different groups of clusters in local and systemic leaves. All Venn diagrams had a hypergeometric testing significance of P < 0.001. L, local; S, systemic; RBOHD, respiratory burst oxidase homolog D.
