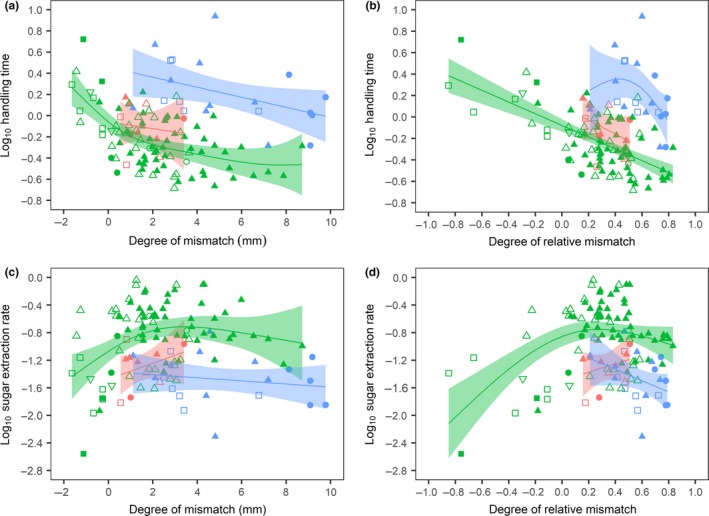
Figure 2.

Handling time as a function of (a) degree of mismatch (R 2 adj = 0.47, P < 0.001) and (b) degree of relative mismatch (R 2 adj = 0.53, P < 0.001) and sugar extraction rate as a function of (c) degree of mismatch (R 2 adj = 0.28, P = 0.059) and (d) degree of relative mismatch (R 2 adj = 0.37, P < 0.001). A degree of mismatch or relative mismatch < 0 indicates that floral nectar tube depth exceeds pollinator proboscis length and a degree of mismatch or relative mismatch > 0 indicates that pollinator proboscis length exceeds floral nectar tube depth. Each dot represents a particular insect species visiting a particular plant species. Colours represent the different insect orders (blue: Lepidoptera, green: Hymenoptera and red: Diptera) and the shapes represent the different insect families. Plotted lines are based on univariate analyses. N = 117.
