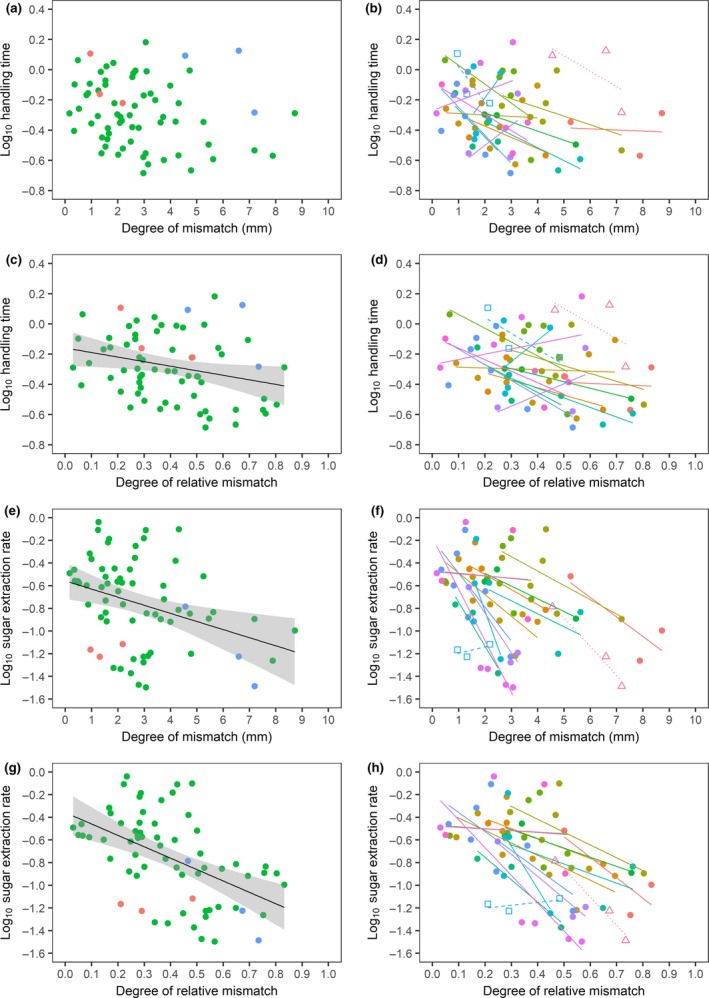
Figure 4.

Handling time as a function of (a) degree of mismatch (R 2 adj = 0.02, P = 0.109, N = 67), (b) species‐specific degree of mismatch (R 2 adj = 0.19, P = 0.030, N = 67), (c) degree of relative mismatch (R 2 adj = 0.06, P = 0.028, N = 67), (d) species‐specific degree of relative mismatch (R 2 adj = 0.18, P = 0.037, N = 67), and sugar extraction rate as a function of (e) degree of mismatch (R 2 adj = 0.11, P = 0.004, N = 67), (f) species‐specific degree of mismatch (R 2 adj = 0.44, P < 0.001, N = 67), (g) degree of relative mismatch (R 2 adj = 0.25, P < 0.001, N = 67), and (h) species‐specific degree of relative mismatch (R 2 adj = 0.47, P < 0.001, N = 67). Figures only show insect species that visit at least three plant species and only interactions of which the nectar tube depth < pollinator proboscis length (positive mismatch). In Figs a, c, e and g, colours represent different insect orders (blue: Lepidoptera, green: Hymenoptera, red: Diptera). In Figs b, d, f and h, colours represent different insect species and shapes represent different insect orders (open triangles: Lepidoptera, closed circles: Hymenoptera, and open squares: Diptera).
