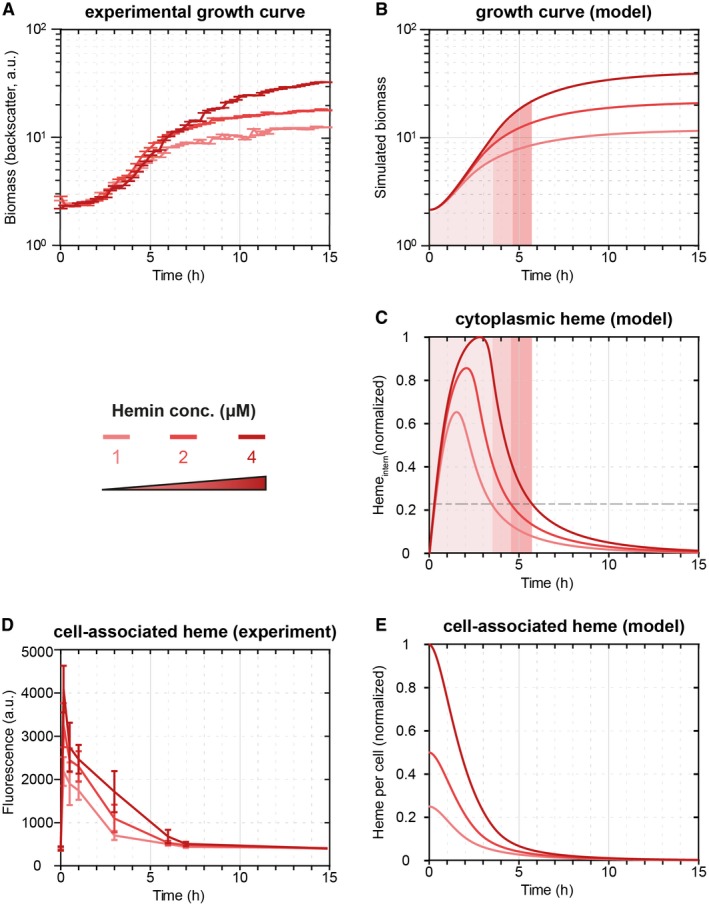
Figure 2.

The mathematical model reproduces the experimental growth curves quantitatively. A. Growth curves of the C. glutamicum wild‐type strain under increasing hemin concentrations (1 μM, 2 μM and 4 μM). B. The mathematical model can reproduce the average growth behavior (left). C. The mathematical model predicts the consumption of cytoplasmic heme required for growth. D. The depletion of cell‐associated heme (sum of internal heme and external heme adhering to the cell) dictates the bacterial growth. The experimental data align with (E) the model predictions of total heme levels per cell (cytoplasmic heme and the portion of external heme per cell). [Colour figure can be viewed at wileyonlinelibrary.com]
