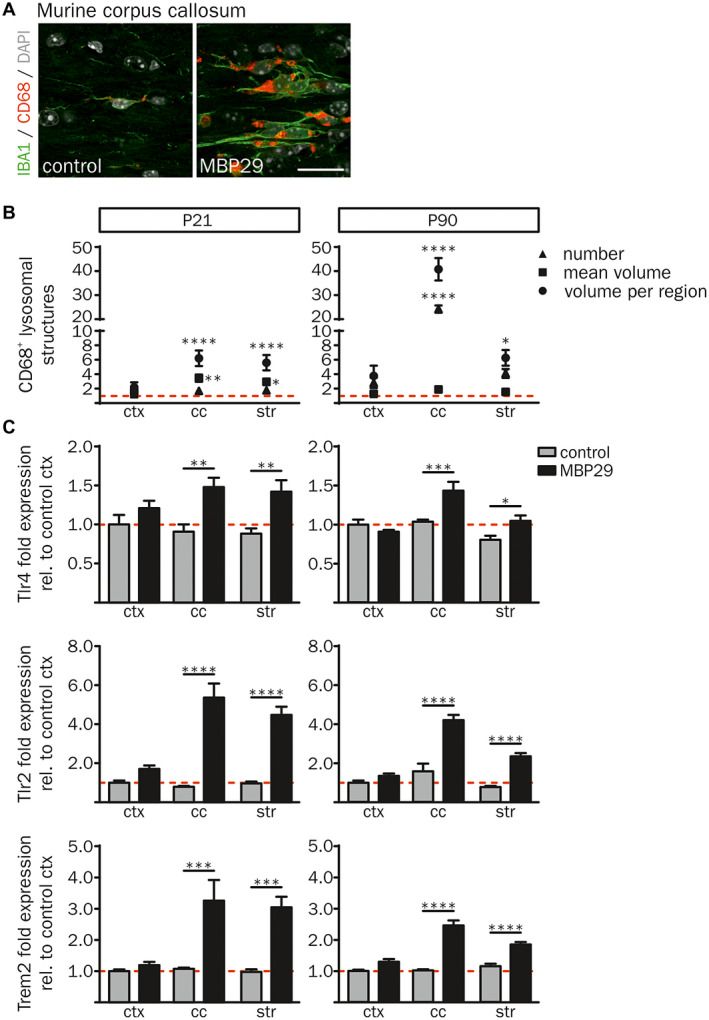
Figure 6.

Activated, phagocytic phenotype of IBA1+ cells in MBP29‐hα‐syn mice. (A) Co‐immunofluorescence staining of IBA1 with the lysosomal‐associated protein CD68 revealed an increased expression of both markers in the cc of MBP29‐hα‐syn mice (right) in comparison to controls (left) at P21. Scale bar: 20 µm. (B) Quantification of the number of CD68+ lysosomal structures (triangle), their mean volume (square) as well as the percentage of their volume per region (circle) in MBP29‐hα‐syn mice relative to controls (red dashed line) revealed increased number and size of CD68+ lysosomal structures in transgenic animals at P21 (left graph) and P90 (right graph). (C) mRNA expression analysis relative to cortical gene expression of control mice. Fold expression of Tlr4 (top), Tlr2 (middle) and Trem2 (bottom) was highly increased in the cc and the str of MBP29‐hα‐syn mice at the age of P21 (left panel) and P90 (right panel). Data represent mean ± SEM (n = 5 animals per group). Statistical analyses were performed using two‐way ANOVA. *P ≤ 0.05, **P ≤ 0.01, ***P ≤ 0.001, ****P ≤ 0.0001. Abbreviation: ctx: cortex, cc: corpus callosum, str: striatum.
