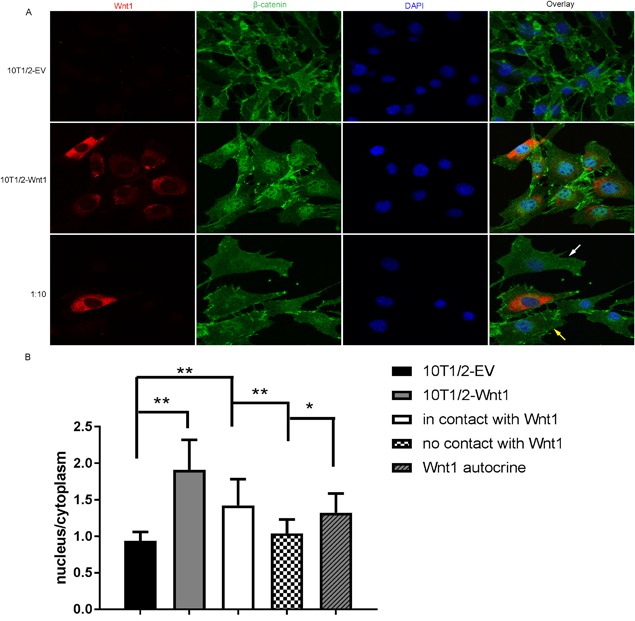
Figure 4.

Wnt1 increased the nuclear accumulation of β‐catenin in neighboring cells. (A) Immunofluorescence staining for Wnt1 (red) and β‐catenin (green) in control C3H10T1/2‐EV cells, mitomycin C‐treated Wnt1 overexpressing C3H10T1/2 cells or mixed culture of mitomycin C‐treated Wnt1 overexpressing C3H10T1/2 cells with control cells in 1:10 ratio. (B) Quantification of the β‐catenin fluorescence intensity in the nuclear and the cytoplasmic compartments, presented as a ratio of nuclear intensity to cytoplasmic intensity. Nonparametric values were analyzed with the Steel‐Dwass method. Data are presented as mean ± SD (n = 10). *p < 0.05, **p < 0.01, ***p < 0.001.
