Figure 5.

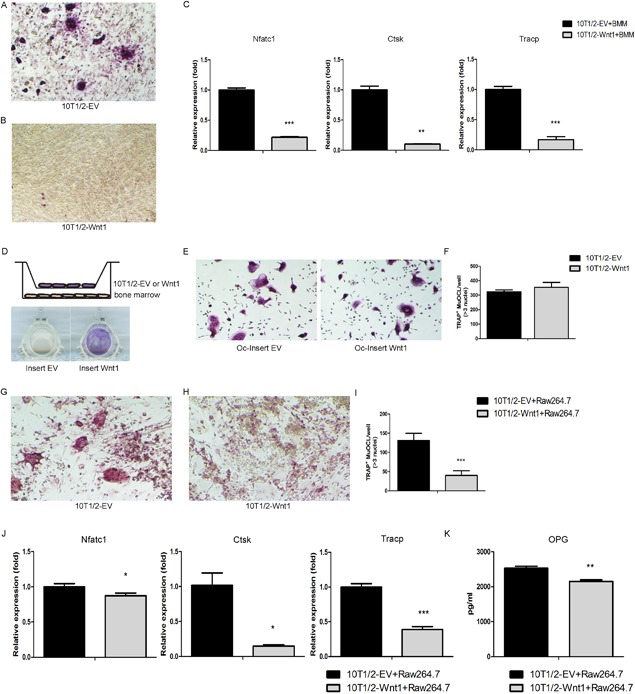
Wnt1 directly suppresses osteoclastogenesis in a juxtacrine manner. (A, B) C3H10T1/2 control (A) or Wnt1‐overexpressing (B) cells were plated on the bottom of cell culture wells and primary bone marrow macrophages (BMM) on top. Osteoclastogenesis was induced by M‐CSF and RANKL. At D5 the cultures were stained for TRAP to demonstrate mature multinucleated osteoclasts. (C) mRNA expression of osteoclast‐specific genes measured by qRT‐PCR in C3H10T1/2 control or Wnt1 overexpressing cells co‐cultured with nonadherent hematopoietic cells at D5. (D) Schematic of the method to study effect of secreted factors from C3H10T1/2‐EV/Wnt1 cells on osteoclastogenesis. Osteoclastogenesis was induced by M‐CSF and RANKL. ALP staining of cell culture inserts at D5 demonstrating the effect of Wnt1 in 10T1/2‐Wnt1 cells. (E, F) TRAP staining of bone marrow cells on cell culture wells after removing the cell culture inserts (E); TRAP‐positive cells were counted from five fields of each three wells per condition (F). (G–I) C3H10T1/2 control (G) or Wnt1‐overexpressing cells (H) were plated on the bottom of cell culture wells and growth‐arrested with mitomycin C and Raw264.7 cells were plated on top. Osteoclastogenesis was induced with RANKL. At D5 the cultures were stained for TRAP to evaluate osteoclastogenesis (I). (J) mRNA expression of osteoclastic genes measured by qRT‐PCR in C3H10T1/2 co‐cultured with Raw264.7 cells at D5. (K) C3H10T1/2 control or Wnt1‐overexpressing cells were co‐cultured with Raw264.7 cells and osteoclastogenesis was induced by RANKL. The supernatants were collected to measure OPG levels by ELISA. All cell culture experiments were repeated three independent times with at least three replicate wells per condition. Data are presented as mean ± SD (n = 3). *p < 0.05, **p < 0.01, ***p < 0.001. Statistical analysis was performed by Student's t test. TRAP = tartrate‐resistant acid phosphatase.
