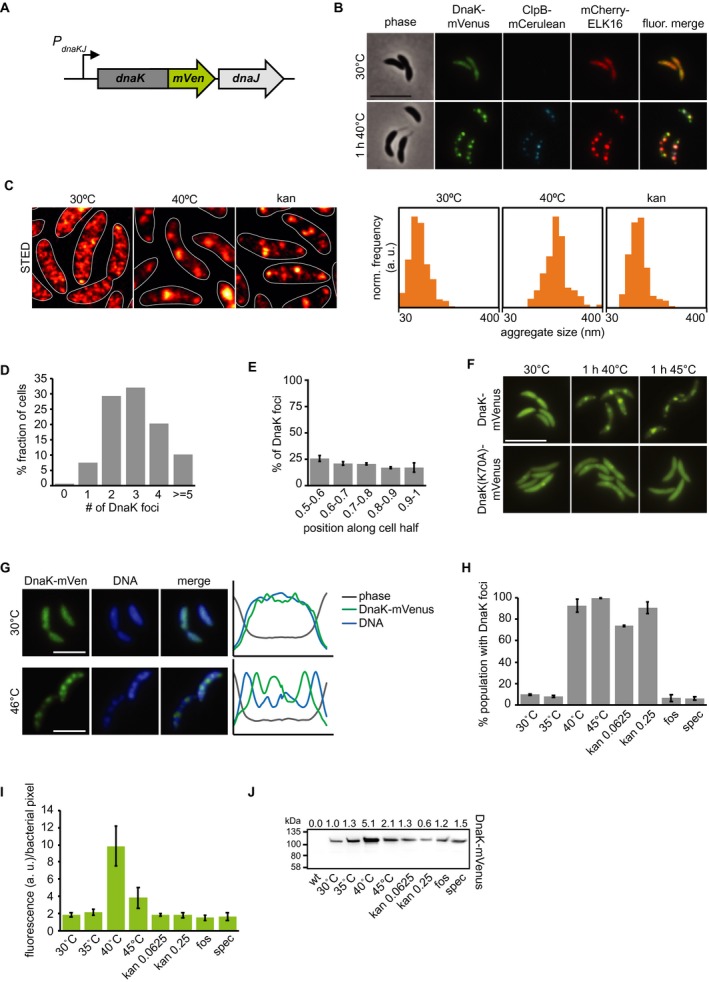
Figure 1.

Stress induces relocalization of chaperone machinery to foci of protein aggregation. A. Fluorescent fusions to proteins at their native locus are used to visualize the location of chaperones. B. Microscopy of DnaK‐mVenus, ClpB‐mCerulean and mCherry‐ELK16 expressed at 30°C and after 1 h of heat shock at 40°C. Scale bar is 5 µm. C. Representative images demonstrating DnaK‐mVenus localization at super‐resolution with STED imaging following incubation at 30°C, 1 h at 40°C, and after 1 h treatment with 0.25 g/ml kanamycin. STED images are smoothed and cell outlines are shown in white. The histograms show the distribution of DnaK‐mVenus cluster sizes, with all histograms showing the size range of 30–400 nm, and a bin width of 25 nm. Histograms show the size distribution of at least 118 clusters, from at least 75 cells. Cluster sizes are significantly different between all conditions (Kolmogorov–Smirnov test, p < 0.05). D. Quantification of the number of aggregates per cell and E. graph illustrating the position of the aggregates along five bins from midcell (0.5) to the cell pole (1) in cells exposed to 1 h of 40°C in liquid culture. Quantifications in (D) and (E) show the means of biological triplicates for which at least 196 cells and 685 aggregates each were analyzed respectively. Error bars represent standard deviations. F. Microscopy comparing localization of DnaK‐mVenus with DnaK(K70A)‐mVenus at 30°C and after 1 h at 40°C. Scale bar is 5 µm. G. Fluorescence microscopy demonstrating localization of DnaK‐mVenus and the chromosome, stained with Hoechst 33258, after incubation at 30°C and 46°C. Line profiles (right) demonstrate fluorescence or phase contrast signal over the length of a representative cell from each treatment group. Signals are plotted as the percentage of the maximum value. Scale bar is 2.5 µm. H. DnaK‐mVenus foci formation in response to different stress conditions. Cultures of the DnaK‐mVenus strain were exposed to the indicated temperature or treated with 0.0625 g/mL or 0.25 g/mL kanamycin, 20 g/mL fosfomycin (fos) or 100 g/mL spectinomycin (spec) for 1 h followed by visualization and quantification of the number of cells with DnaK‐mVenus foci. Quantifications show the means of biological duplicates where 300 cells each were analyzed. Error bars represent standard deviation. I. Quantification of DnaK‐mVenus fluorescence intensity under different stress conditions. Cultures of the DnaK‐mVenus strain were treated as in (H) followed by imaging and quantification of fluorescence intensity per total bacterial area. Quantifications show the means of biological duplicates where at least 339 total cells each were analyzed from at least 10 independent images. J. Quantification of protein levels of DnaK‐mVenus under the conditions described in (H) and (I) by western blot. Band intensities are shown as average of two replicates above the western blot image.
