Figure 3.

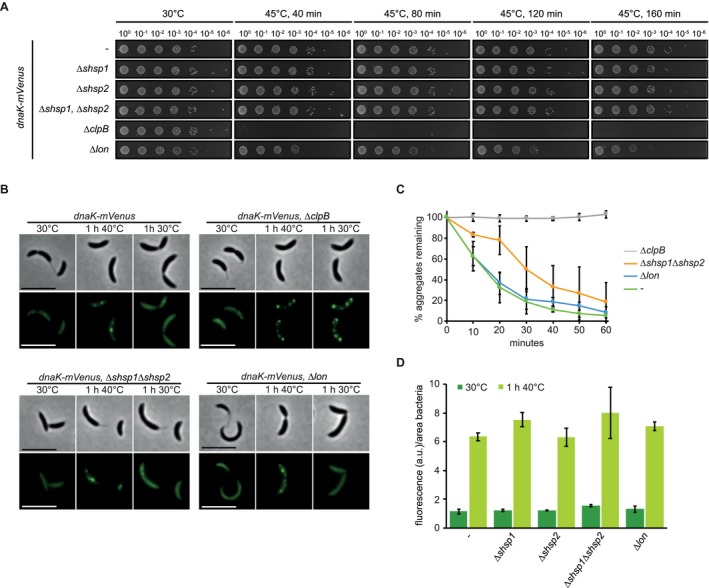
Contribution of chaperones and proteases to stress resistance. A. Spot assays comparing colony formation of wild type, the dnaK::dnaK‐mVenus strain and its derivative strains harboring chaperone and protease knockouts grown at 30°C without stress treatment or after 40, 80, 120 or 160 min of incubation at 45°C. B. DnaK‐mVenus localization in the same strains as in (A) grown at 30°C or after heat shock in liquid culture at 40°C for 1 h (1 h 40°C panels). After 40°C heat shock, cells were permitted to recover at 30°C for 1 h (1 h 30°C panels), during which aggregate dissolution was monitored by time lapse microscopy. Scale bar is 5 µm. C. Quantification of the percentage total aggregates remaining during recovery at 30°C for 1 h. Cultures were exposed to 40°C heat shock for 1 h followed by monitoring aggregate dissolution by time lapse microscopy. Quantifications show the means of biological triplicates in which the longevity of at least 184 total aggregates were measured. D. Absolute measurements of DnaK‐mVenus fluorescence during growth at 30°C and after 1 h heat shock at 40°C. Due to increased sensitivity to heat stress, ∆clpB was excluded from this analysis (See Fig. S2 for further analysis of this strain). Quantifications show the means of biological duplicates where at least 409 cells each were analyzed from 10 independent images.
