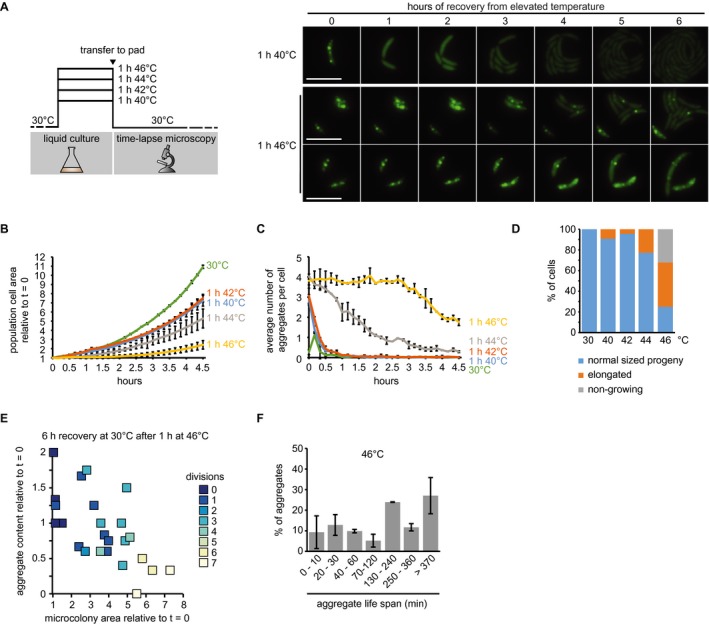
Figure 5.

Growth and aggregate resolution following stress recovery. A. Schematic of recovery experiments (left) and representative images from recovery after exposure to 40 and 46°C for 1 h. Two panels are shown for the 46°C condition to represent the diversity of cell fates after stress release. Scale bar is 5 µm. B. Quantifications of fluorescence time‐lapse microscopy showing the average number of aggregates per cell in cell populations recovering from 1 h of exposure to 40, 42, 44 and 46°C. C. Total cell area increase over time after release from 1‐h exposure to 40, 42, 44 and 46°C relative to the first time point (t = 0). Quantifications in (B, C) show the means of biological duplicates for which at least nine microcolonies each were analyzed. The data on cells continuously grown at 30°C are the same as in Fig. 4. Error bars represent standard deviations. D. Quantification of cell fates during continuous growth at 30°C, or recovery at 30°C after 1 h of exposure to 40, 42, 44 and 46°C. Quantifications are based on tracking at least 21 cells/microcolonies per duplicate condition. Cell/microcolony properties were quantified when the average total area of the population increased to 4 times the initial area. Growing cells/microcolonies were defined as those that at least doubled in area. Elongated cells or microcolonies containing those were considered as such when the average cell length in the microcolony was at least 1.5 times higher than the average cell length of a population grown to 4 times the cell area under continuous 30°C conditions. E. Scatter plot representing relative area increase, relative aggregate number normalized to the amount present at stress release and the number of divisions of 24 cells and their potential progeny after 6 h (the time at which the average area of the population has quadrupled) at 30°C on pad after release from 1 h of exposure to 46°C. F. Quantification of aggregate life span in cells recovering from exposure to 1 h 46°C forming microcolonies of mostly normally sized cells (D). Aggregates present or emerging in the first 400 min of a fluorescence time‐lapse movie were tracked until 500 min. Images were acquired every 10 min. Quantifications show the means of biological duplicates for which at least eight microcolonies and 54 aggregates each were analyzed. Error bars represent standard deviations.
