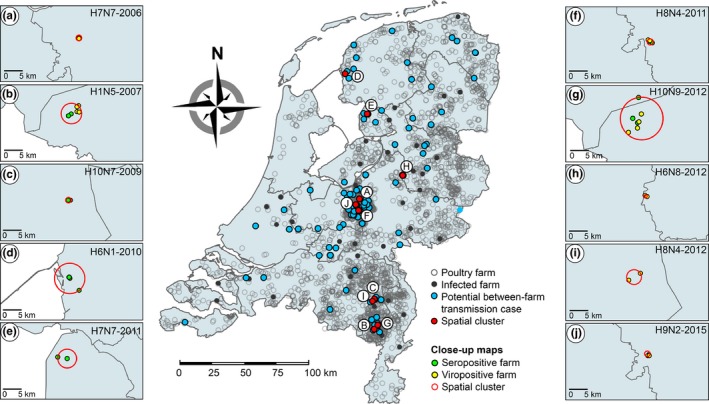
Figure 1.

Geographical map of potential between‐farm transmission cases. Map of the Netherlands showing the geographical distribution of commercial poultry farms (open dots) (n = 2,379), farms infected with low pathogenic avian influenza (LPAI) virus (filled dots) (n = 220), farms involved in potential between‐farm transmission cases (blue) (n = 132) and statistically significant spatial clusters (red) (n = 10), including close‐up maps of 10 spatial clusters of seropositive farms (green) and viropositive farms (yellow) within potential between‐farm transmission cases H7N7‐2006 (a), H1N5‐2007 (b), H10N7‐2009 (c), H6N1‐2010 (d), H7N7‐2011 (e), H8N4‐2011 (f), H10N9‐2012 (g), H6N8‐2012 (h), H8N4‐2012 (i) and H9N2‐2015 (j). Spatial cluster analysis was performed for each potential between‐farm transmission case separately using the Bernoulli probability model (p < 0.05). All samples were collected as part of the national avian influenza (AI) surveillance program in the Netherlands between January 2006 and September 2016
