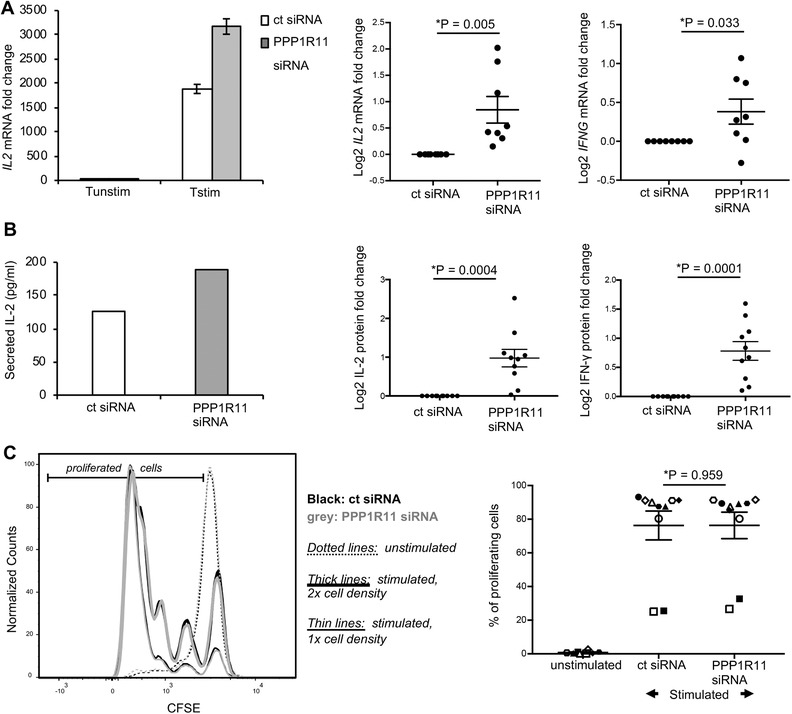
Figure 3.

PPP1R11 silencing augments TCR‐induced cytokine expression in T cells. T cells were treated with 2 µM of PPP1R11 siRNA pool or nontargeting siRNA for 4.5 days and then activated for (A) 3 h (mRNA studies) with cross‐linked anti‐CD3/‐CD28 (TCR) Ab stimulation or (B and C) 4.5 days with plate‐bound anti‐CD3 and soluble anti‐CD28 Abs at 37˚C. (A) Respective cytokine mRNA levels measured by qRT‐PCR were normalized to GAPDH and represented as fold changes compared to expression levels in unstimulated cells (set to 1) treated with respective siRNAs. (Left) Representative figure for IL2 mRNA (mean ± sd of PCR triplicates) expression upon treatment with control siRNA (white bars) and PPP1R11 siRNA (grey bars). (Middle and right) Averaged log2 value for respective mRNAs (mean ± sem of 8 donors) (P = 0.005 for IL2 and P = 0.003 for IFNG) are expressed as fold change with respect to control siRNA (log2 set to 0). P‐values were determined by unpaired, one sample, 2‐sided t‐test (* P < 0.05). (B and C) T cells were labeled with CFSE prior to siRNA‐treatment. (B) Respective cytokine concentrations in the supernatants of T cells treated with respective siRNAs were measured by multiplex bead‐array immunoassay and represented by figures on the left. (Middle and right) Averaged figures for respective cytokine concentrations (mean ± sem of 10 donors; P = 0.0004 for IL‐2 and P = 0.0001 for IFN‐γ) are expressed as fold change with respect to control siRNA‐treated cells (log2 set to 0). P‐values were determined by unpaired, one sample, 2‐sided t‐test (* P < 0.05). (C) Left panel: Proliferation was assessed by flow cytometry by gating on live (viability dye‐negative), singlet, CD3+CD4+CFSE+ T cells. Unstimulated T cells (dotted lines) were used as control. Overlaid CFSE histograms are shown for a representative donor (for control siRNA‐treated cells in black and PPP1R11 siRNA‐treated cells in grey, and for 2 different starting cell densities each as indicated by thick or thin lines, respectively). The right panel represents averaged values for percentage of proliferating cells (gate as indicated in the left panel) from 10 donors in 3 separate experiments (mean ± sem). Each symbol represents an individual donor. Percentage of proliferating cells was calculated as percentage of CFSE‐diluting cells of total CFSE‐positive cells. P‐values were determined by paired, 2‐sided Student's t‐test
