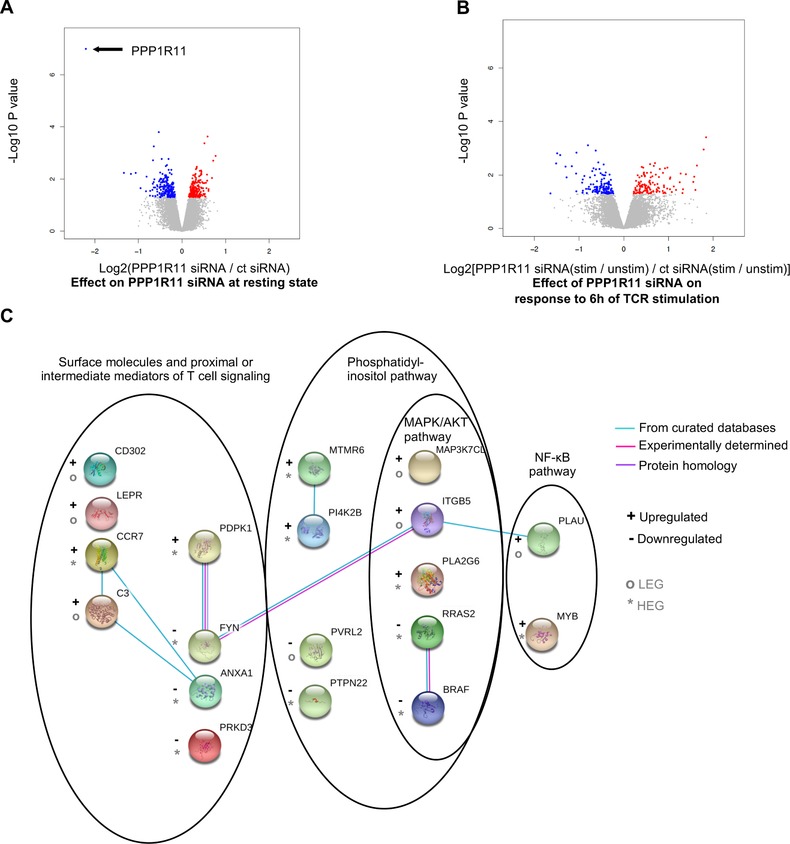
Figure 4.

PPP1R11 affects the baseline and T cell activation‐induced transcriptome of T cells. T cells were treated with either control or PPP1R11 siRNA for 4.5 days and then either stimulated with cross‐linked anti‐CD3/‐CD28 Abs for 6 h or left unstimulated for RNAseq analysis. (A and B) For relative fold change, log2 of average ratios of normalized gene counts in each comparison were plotted against P‐value of the respective change. Differentially expressed genes (DEGs; P < 0.05) are colored in red (up‐regulated) or blue (down‐regulated) in each comparison. P‐values were calculated with moderated t‐test using the Limma package in R. (A) Figure represents differential effect of PPP1R11 siRNA over control siRNA at resting stage. (B) Figure represents differential response of PPP1R11 silenced cells over control siRNA silenced cells to TCR stimulation. (C) PPP1R11 silencing differentially regulates genes associated with phosphatidyl inositol, MAPK, AKT, and/or NF‐κB pathways upon TCR stimulation. DEGs associated with these pathways were used to curate a gene network in the STRING web‐platform. Only known interactions were used to represent connections between the nodes (color coding, see in the figure). Schematic crystal structures of the proteins are also provided where available. The nodes are roughly arranged according to the subcellular locations and genes involved in respective pathways are encircled for better visualization. “+” or “–” signs are used to represent up‐regulation or down‐regulation of genes, respectively, upon PPP1R11 silencing over control siRNA treatment. Furthermore, “*” or “°” signs are used to represent highly or lowly expressed genes (HEG or LEG), respectively
