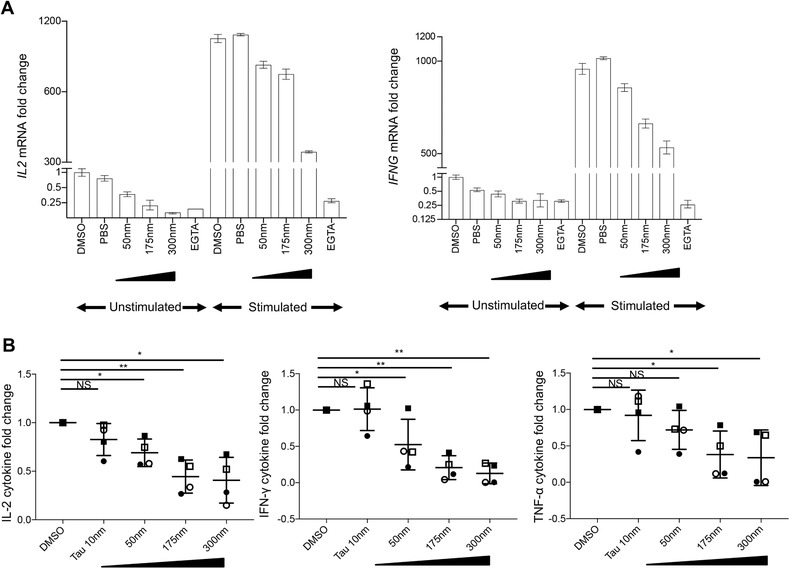
Figure 5.

Chemical inhibition of the PPP1R11 target PP1 dampens T cell activation‐associated cytokines. T cells were treated with indicated concentrations of PP1 inhibitor tautomycetin for 5 h at 37˚C and activated for (A) 3 h with soluble cross‐linked anti‐CD3/‐CD28 Abs for mRNA studies or (B) 5.5 days with plate‐bound anti‐CD3 and soluble anti‐CD28 Abs for cytokine studies in the supernatant at 37˚C. DMSO‐treated and PBS‐treated cells were used as vehicle control and negative control, respectively, while EGTA‐treated cells were used as positive control for mRNA studies. DMSO‐treated cells were used as vehicle control for cytokine studies in the supernatant. Both unstimulated and stimulated cells were measured for mRNA studies by qRT‐PCR while only stimulated cells were measured for cytokine protein studies by multiplex bead‐array immunoassay. (A) Respective cytokine mRNA levels were normalized to GAPDH and are represented as fold changes compared to expression levels in unstimulated DMSO‐treated cells (set to 1). Representative results for IL2 mRNA (left) and IFNG mRNA (right) from 2 donors are shown (mean ± sd of PCR triplicates). (B) Respective cytokine concentrations for varying doses of tautomycetin are represented as fold change compared to cytokine concentration for DMSO‐treated cells (set to 1). Averaged result for IL‐2 (left), IFN‐γ (middle), and TNF‐α (right) is shown (mean ± sem of 4 donors). P‐values were determined by paired, one‐sample, 2‐sided t‐test (* P < 0.05 and ** P < 0.005). Individual symbols represent individual donors
