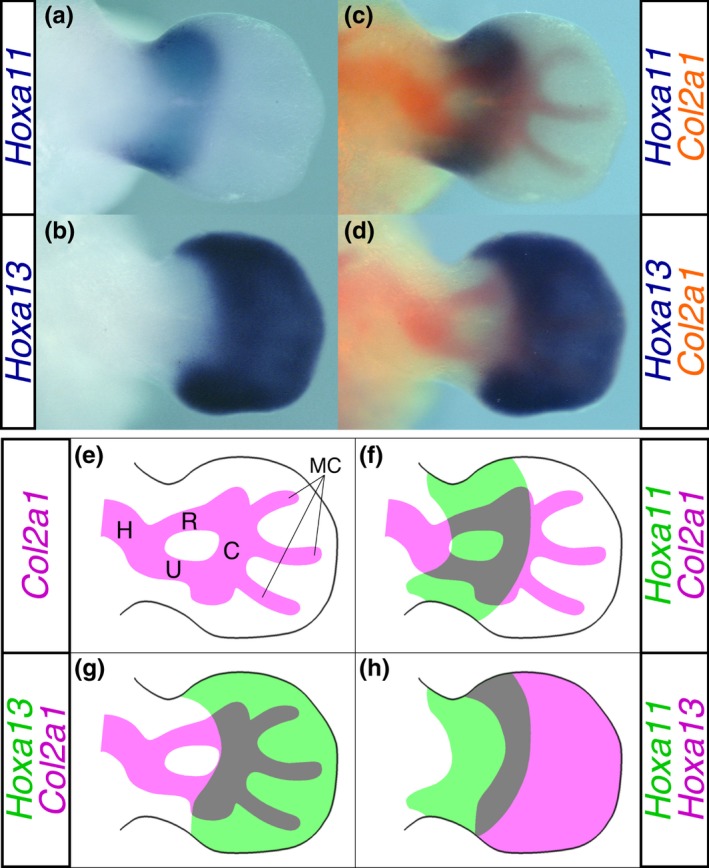
Figure 1.

Correlation between the Hox expression domain and cartilage in the E11.75 mouse forelimb bud. Dorsal view of in situ hybridizations for (a) Hoxa11 and (b) Hoxa13. The cartilage pattern was visualized based on the Col2a1 expression (red) in the same limb bud (c and d). (b) and (d) are presented as a digitally inverted (left‐right) views of the original picture. (e) Illustration of the cartilage pattern shown in (c). C: carpus, H: humerus, MC: metacarpus R: radius, U: ulna. (f) and (g) Representative drawings of (c) and (d), respectively. (h) Superimposed view of the Hoxa11 and Hoxa13 expression domains. Images redrawn based on relative location of each Hox expression domain to the cartilage pattern shown in (f) and (g). The left and right limb buds were isolated from a single embryo at E11.75 and were hybridized with DIG‐labeled Hoxa11 and fluorescein‐labeled Col2a1 probe mixture and DIG‐labeled Hoxa13 and fluorescein‐labeled Col2a1 probe mixture, respectively. Hox expression was detected using anti‐DIG IgG‐alkaline phosphatase (AP) with BM Purple as the substrate (blue). After inactivating AP activity, Col2a1 expression was detected using anti‐fluorescein IgG‐AP with Fast Red as the substrate (red)
