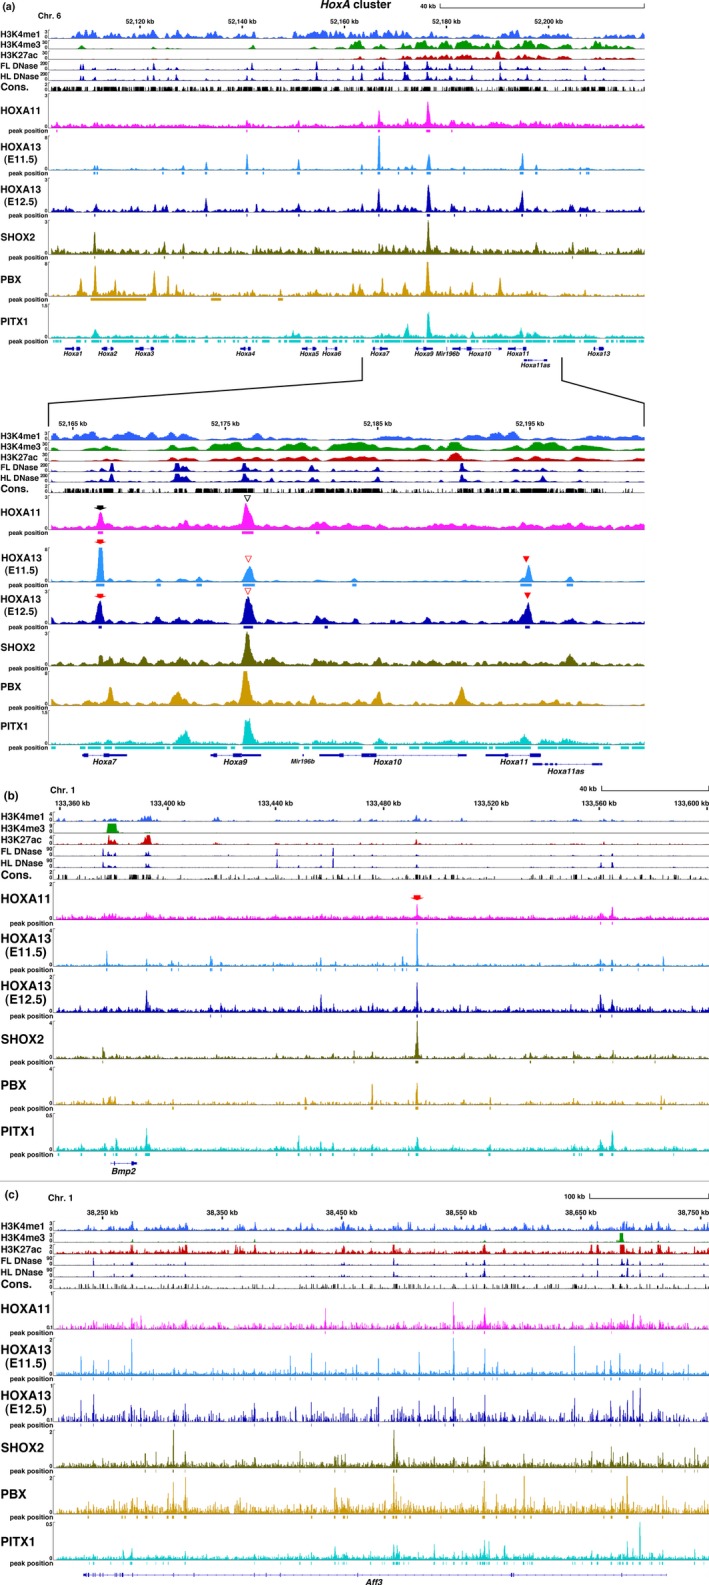
Figure 2.

IGV view of HOX11/13 and homeodomain transcription factors in the limb bud. (a) HoxA cluster, (b) Bmp2, (c) Aff3. The epigenetic state of each gene determined by enrichment of H3K4me1, H3K4me3 and H3K27ac in the limb buds and DNase I hypersensitivity sites in the E11.5 limb bud (FL DNase, HL DNase, FL: forelimb bud, HL: hindlimb bud) and sequence conservation among vertebrates (Phastcons [Vertebrate 30way]) presented as a bar graph. Data were obtained from public data bases as described in Supporting Information Table S6. ChIP‐Seq data for HOXA11 and HOXA13 using E11.5 limb bud (HOXA11 and HOXA13(E11.5)) and E12.5 autopod (HOXA13(E12.5)) from this study are presented as a bar graph. The SHOX2 and PBX binding profiles in the E12.5 limb bud and the PITX1 binding profile in the E11.5 hindlimb bud were visualized by reanalysis of published data source presented in Supporting Information Table S6 using the same platform as for the HOX11/13 data. Numbers in the vertical axis indicate coverage values that were scaled by 1,000,000/total count. Squares beneath the peak indicate the region identified as transcription factor binding by MACS2 analysis. (a) Arrow: intron of Hoxa7, open arrowhead: 5′ UTR of Hoxa9, arrowhead: intron of Hoxa11. (b) Arrow: the CHBRL deleted in Bmp2cis KO in Figure 5
