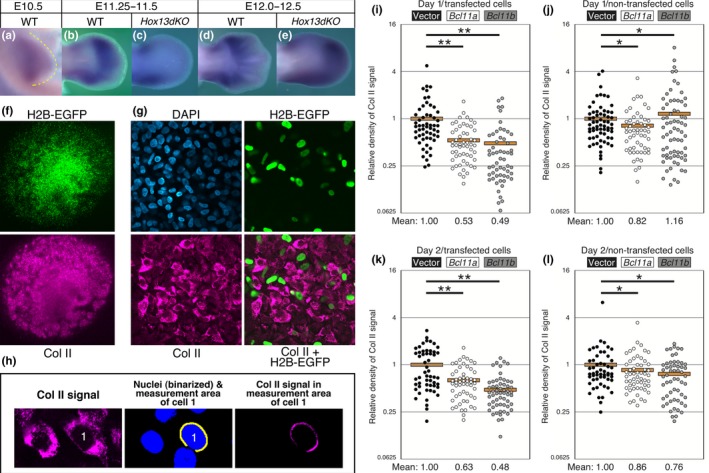
Figure 9.

BCL11a and BCL11b repress cartilage differentiation in micromass culture (MMC). (a) Bcl11a was expressed throughout the entire mesenchyme of the limb bud at E10.5 then became restricted to the autopod and anterior and posterior margin of the more proximal part of the limb (b) at E11.5. Bcl11a expression was detected in the interdigital region (d) at E12.0. In the Hox13dKO limb (c) at E11.5, autopodal expression was severely reduced but (e) at E12.5 uniform expression was detected throughout the autopod. (f) Histone H2B‐EGFP (H2B‐EGFP) fluorescence and Col II immunofluorescence signals in MMCs incubated for 2 days after transfection with the pCAGGS‐H2B‐EGFP and pCAGGS vector. (g) High magnification confocal images of the MMC in panel f. Nuclei of the transfected cells were marked with H2B‐EGFP. (h) For quantitative analyses of Col II expression in each cell, the intensity of the Col II immunofluorescence signal in the ring‐shaped area (yellow; width: 0.58 μm) around each nucleus (green) was calculated using ImageJ. Neighboring nuclear areas were excluded from the measurement area. (i–l) Ratios of Col II immunofluorescence signal intensity in each cell relative to the mean of the vector transfection control. i, j: 1‐day incubation; k, l: 2‐day incubation. i, k: transfected cells (H2B‐EGFP‐positive); j, l: non‐transfected cells (H2B‐EGFP‐negative). In the graphs, a circle represents one cell, and n ≈ 60 for each transfection. **p < 0.002; *p > 0.01 (Mann–Whitney U‐test). Orange bars indicate the mean of the values
