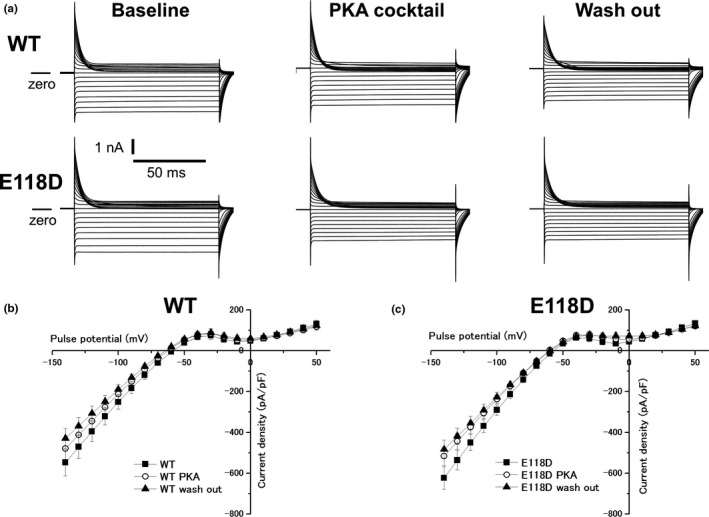
Figure 6.

Effects of catecholaminergic stimulation on expressed currents (IK1) for KCNJ2 WT and KCNJ2 E118D. (a) Representative currents for KCNJ2 WT (upper panels) and KCNJ2 E118D (lower panels) obtained by the pulse protocol shown in the inset of Figure 5a. Currents were recorded at baseline (left panels), in the presence of a PKA cocktail (middle panels) and after wash out of it (right panels). (b) Current–voltage relationships for KCNJ2 WT obtained at baseline (filled squares, n = 21), in the presence of the PKA cocktail (open circles, n = 21) and after wash out of it (filled triangles, n = 21). (c) Current–voltage relationships for KCNJ2 E118D obtained at baseline (filled squares, n = 30), in the presence of the PKA cocktail (open circles, n = 30) and after wash out of it (filled triangles, n = 30). WT, wild‐type; PKA, protein kinase A
