Figure 3.

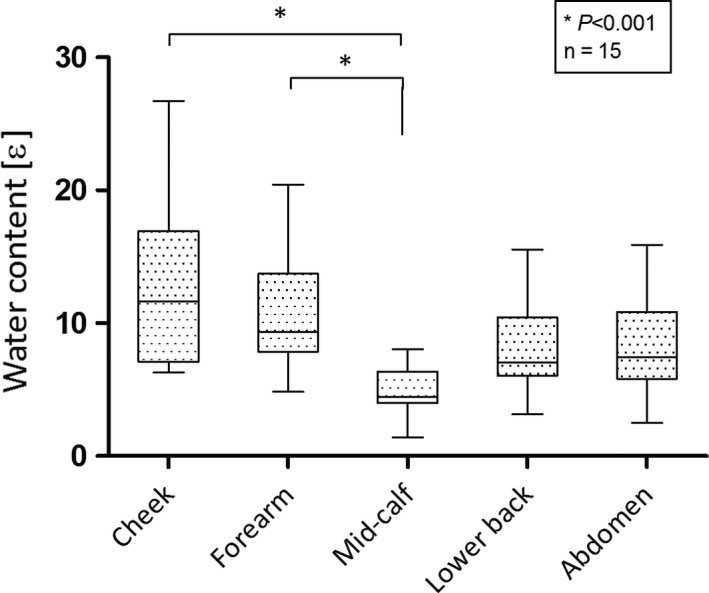
Water content at five body sites measured with the Epsilon. The values are expressed as median with interquartile range and range (minimum‐maximum)

Water content at five body sites measured with the Epsilon. The values are expressed as median with interquartile range and range (minimum‐maximum)