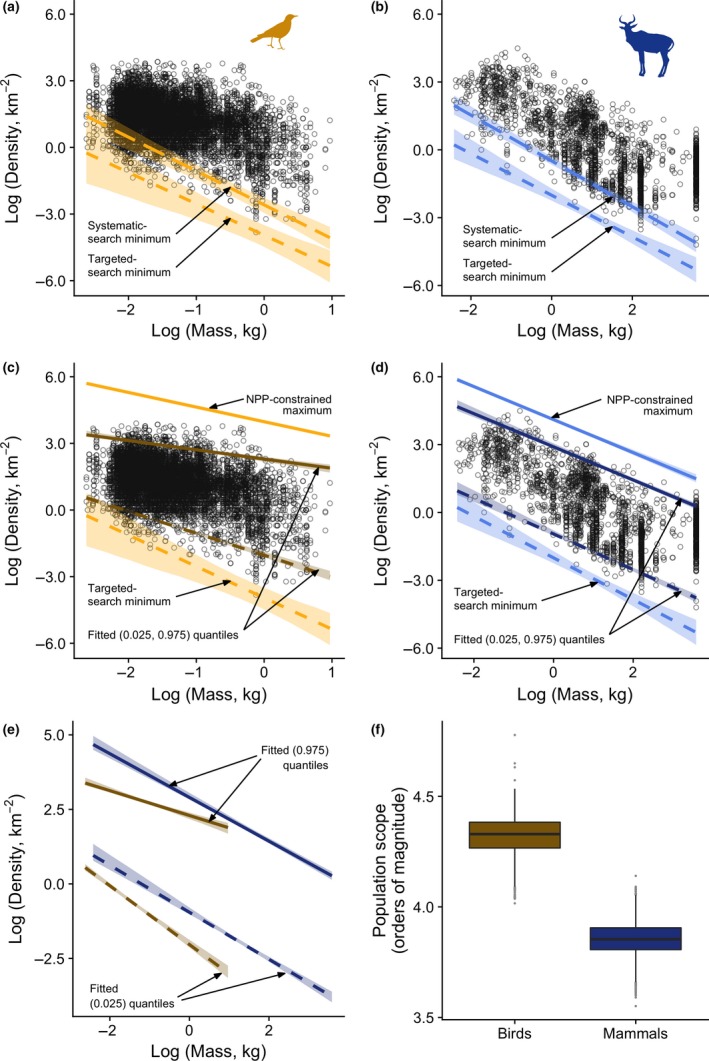
Figure 2.

Collated data on population densities in relation to lower predicted limits for (a) birds and (b) mammals. Predicted limits are based on the systematic search (long dashes) and targeted search (dashes) models. Both upper predicted limits (solid lines) and lower predicted limits based on the targeted‐search model (dashed lines) are shown in relation to the data for (c) birds (lines in gold) and (d) mammals (lines in blue). Fitted 0.025 and 0.975 quantiles are shown for birds (dark gold) and mammals (dark blue). (e) For ease of comparison with the qualitative predictions of Fig. 1b, the fitted quantiles for birds (dark gold) and mammals (dark blue) are shown together. Polygons in panels A–E indicate bootstrapped 95% confidence intervals. (f) Empirical population scope (the range of population densities at which populations of a given body size are found) estimated for animals of 1 kg body mass. Variation in the estimates arises from the 2000 bootstrap replicates drawn from the underlying raw data. The line across each box indicates the median and the box boundaries indicate the interquartile range (IQR). Whiskers identify extreme data points that are not more than 1.5 times the IQR on both sides; the dots are more extreme outliers.
