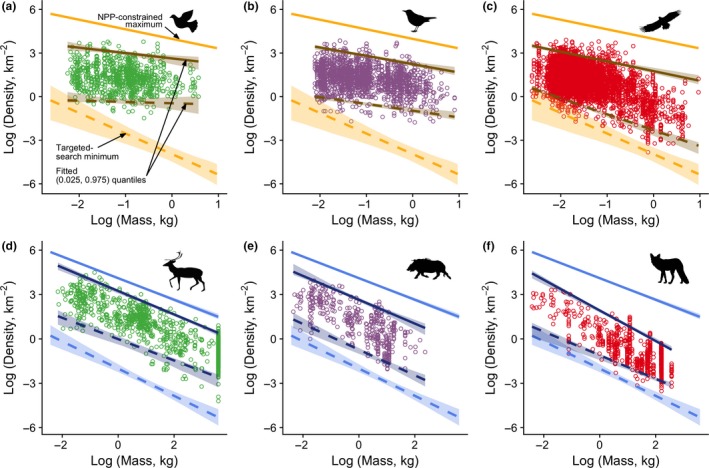
Figure 3.

Population densities, trophic guilds and density limits for avian herbivores (a) omnivores (b) and carnivores (c), and mammalian herbivores (d), omnivores (e) and carnivores (f). In each panel, data points show the raw data on population densities. Both upper predicted limits (solid lines) and lower predicted limits based on the targeted‐search model (dashed lines) are shown in relation to the data (birds, upper panels, lines in gold; mammals, lower panels, lines in blue). Fitted 0.025 and 0.975 quantiles are shown for birds (upper panels, dark gold) and mammals (lower panels, dark blue).
