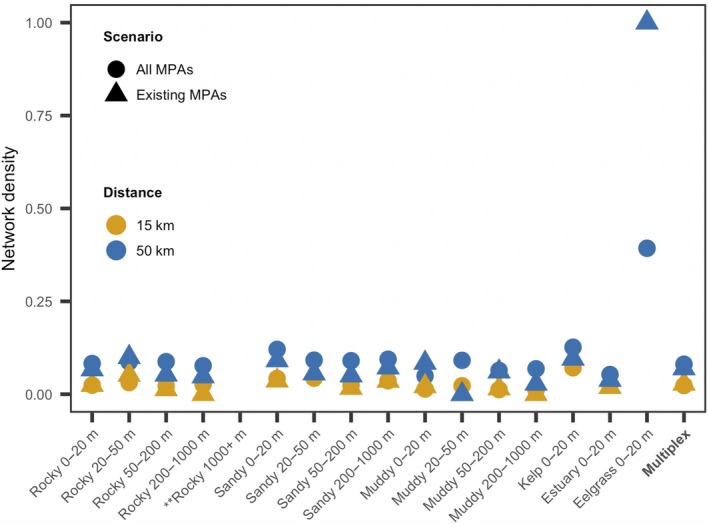
Figure 4.

MPA network density for existing MPAs, as well as existing and potential MPAs, at two distance thresholds. Network density, the proportion of inferred connections to possible connections if every MPA was connected to every other MPA, was computed for 16 habitat categories and for a multiplex network. No MPAs contained rocky habitat with >1,000 m depth. Two habitat patches were eelgrass; eelgrass network densities at the 15‐km distance threshold are identical to, and therefore obscured by, the network densities at the 50‐km threshold. This figure generated using the ggplot2 package in R (Wickham 2016).
