
Figure 4.
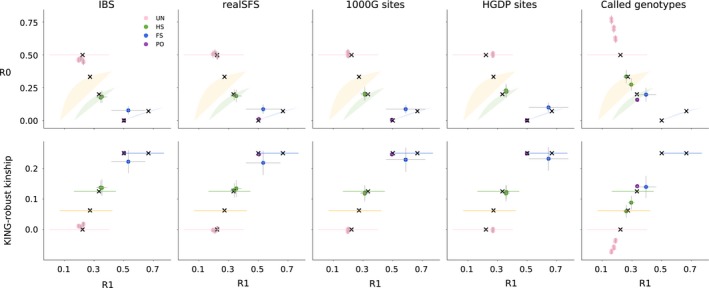
Relatedness plots for all pairs among five LWK individuals from the 1000G Project. (Top) R1–R0 scatterplots for pairs of five LWK individuals for five different analysis approaches: (1) IBS: estimation from (~4×) 1000G bam files, (2) realSFS: site‐frequency spectrum‐based estimation from (~4×) 1000G bam files, (3) 1000G sites: genotype counting using curated 1000G genotypes from the 1000G project, (4) HGDP sites: genotype counting using curated 1000G genotypes but only at sites that overlap with the Illumina 650Y array used for the HGDP, and (5) called genotypes: genotype counting using genotypes called de novo from (~4×) 1000G bam files. Points are coloured by their true relationship status, as reported by 1000G. Thin grey lines show confidence intervals (±2 SE) estimated using a chromosome jackknife. Coloured shaded areas/lines show the theoretically derived range of expected values for specific relationship categories from Figure 2. Black “X”s show the values for pairs with different relationships simulated under a constant population size, as in Figure 2. (Bottom) R1‐KING‐robust kinship scatter plots for the same data sets, confidence intervals and expected ranges are constructed in the same way