
Figure 5.
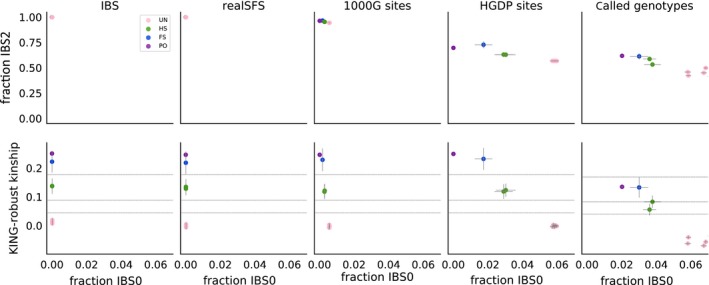
Results from two alternate frequency‐free methods to different subsets and types of data from five 1000 Genomes samples. (Top) Results from applying the plotting approach from Rosenberg (2006) to pairs of the same five LWK individuals for five different analysis approaches: 1) IBS: estimation from (~4×) 1000G bam files, 2) realSFS: site‐frequency spectrum based estimation from (~4×) 1000G bam files, 3) 1000G sites: genotype counting using curated 1000G genotypes from the 1000G project, 4) HGDP sites: genotype counting using curated 1000G genotypes at sites that overlap with the Illumina 650Y array used for the HGDP and 5) genotype counting using called genotypes: genotype called de novo from (~4×) 1000G bam files. Pairs are coloured by their true relationship status, as in Figure 3. Fraction IBS0/IBS2 are the overall fraction of sites that are IBS0/IBS2, respectively. Grey lines centred on each point show confidence intervals (±2 SE) based on a chromosome jackknife. (Bottom) Results from applying the KING‐robust based approach to the same pairs of LWK individuals using the same five different analysis methods as above. The horizontal black lines show the kinship thresholds used to distinguish unrelated (UR), first cousins (C1) half‐siblings (HS), full‐siblings (FS) and (PO) following (Manichaikul et al., 2010) from bottom to top, respectively. Thin grey lines centred on each point show confidence intervals (±2 SE) estimated using chromosome jackknife