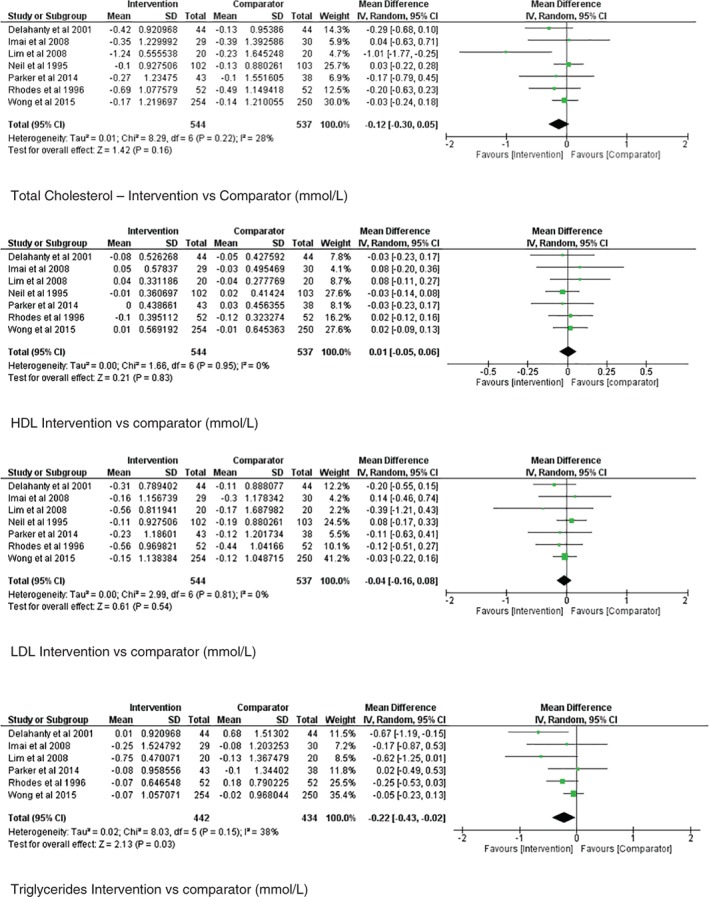
Figure 2.

Forest plots showing comparisons for individual counselling versus minimal or usual care for reducing (a) TC, (b) HDL, (c) LDL and (d) TG in mmol/L.

Forest plots showing comparisons for individual counselling versus minimal or usual care for reducing (a) TC, (b) HDL, (c) LDL and (d) TG in mmol/L.