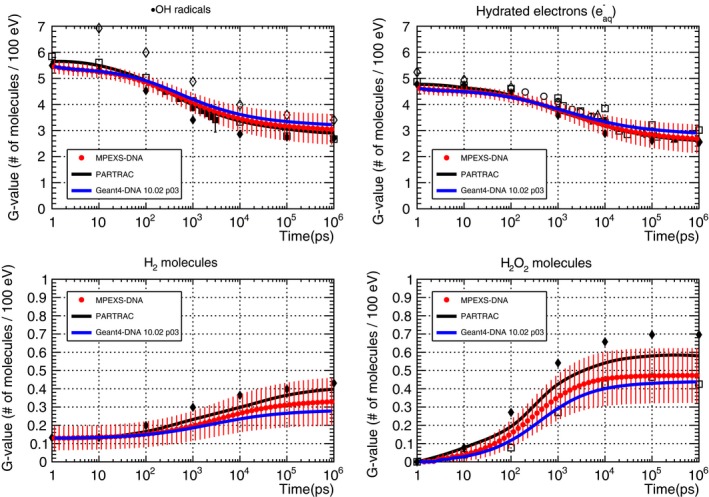
Figure 8.

Comparison of G‐value time profiles of radicals (top left), hydrated electrons (top right), H2 molecules (bottom left), and H2O2 molecules (bottom right) induced by electrons with kinetic energy 750 keV in liquid water. MPEXS‐DNA is represented by filled red circles with vertical bars representing the standard deviation. Geant4‐DNA 10.02 p03 and PARTRAC23 are soild blue and black lines, respectively. The other points are experimental and theoretical calculation results (Experimental data: open circles,28 filled squares,29 open triangles,30 filled triangles,31 calculations : filled diamonds,32 open diamonds,33 open squares34).
