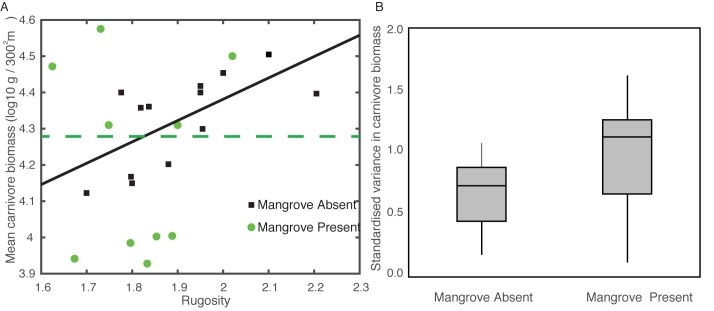
Fig 5. Empirical trends in predator biomass with and without mangrove nurseries.
The relationship with habitat complexity (A) and differences in the variance in biomass among sites within a mangrove treatment (B). Panel (A) includes regression fits, where the significant regression for mangroves absent is predator biomass, (log10) = 3.20 + 0.589 * rugosity. The reef site protected from fishing is shown with an open square. Panel (B) presents boxplots of variance in carnivore biomass with median and interquartile range. The data underlying this figure can be found at https://zenodo.org/badge/latestdoi/185491459.

