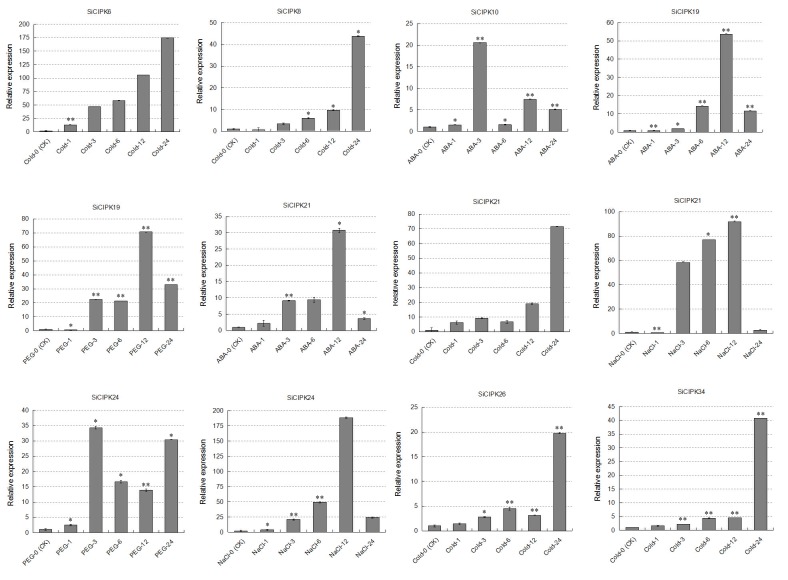
Fig 7. SiCIPKs whose expression is strongly induced by stress treatments.
The relative expression levels of SiCIPKs were quantitatively calculated according to the 2-ΔΔCt method. Gene expression was measured at six time points (0 h, 1 h, 3 h, 6 h, 12 h and 24 h). The Y-axis indicates the relative expression level, and the error bars represent the standard deviations calculated on the basis of three technical replicates for each biological duplicate. The asterisks indicate significant differences between the treatment and control according to Student's t test (**p < 0.01 and *p < 0.05).

