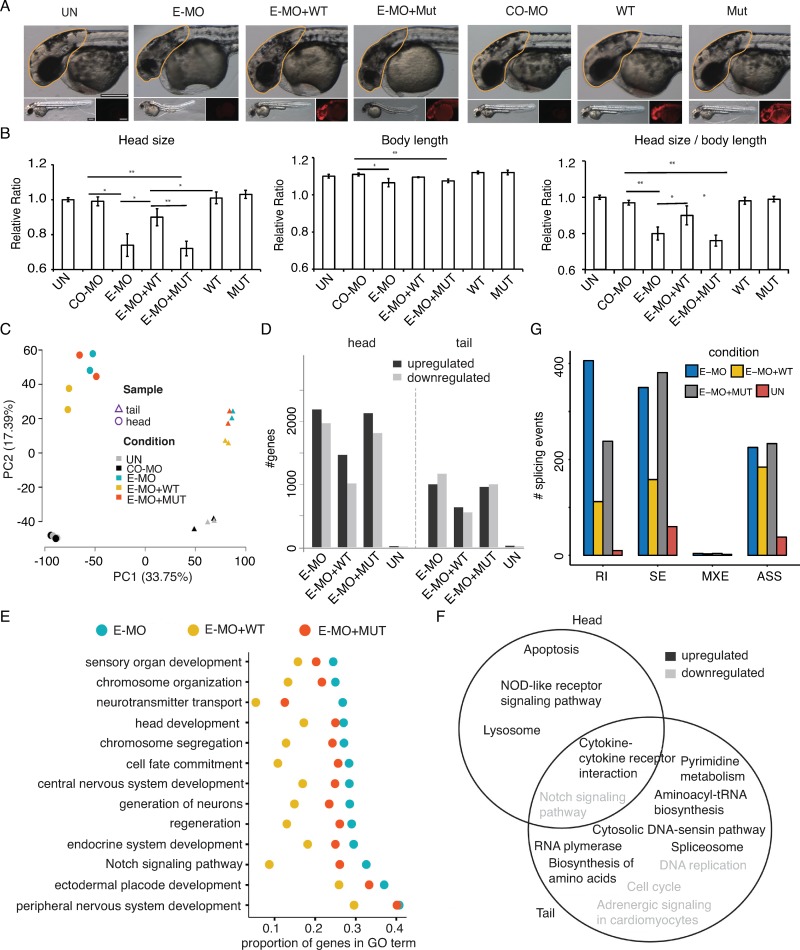
Fig 5. The SNPRE/SmE deficiency interferes with zebrafish brain development.
(A), Measurement of zebrafish head size across different experimental conditions. CO-MO, control morpholino; E-MO, SmE morpholino. The morpholino and/or in vitro transcribed RNA are injected into embryo at 1-cell stage. Yellow line marked the region for quantification. (B), Quantification of zebrafish head size. Left, head size; middle, body length; right, head size normalized by body length. UN, un-injected; CO-MO, control morpholino; E-MO, SmE morpholino; WT, Wide type SmE gene in vitro transcript; Mut, mutant SmE gene in vitro transcript; The UN is normalized to 1. * P<0.05; ** P<0.01. (C), PCA analysis of the expression of 16067 protein coding genes (RPKM > 1) in zebrafish head and tail samples under different conditions. (D), Numbers of differentially expressed genes comparing to CO-MO. (E), Proportion of DEGs in 14 significant enriched dysregulated GO terms (biologic process, E-MO versus CO-MO, BH-adjusted p < 0.001). (F), Overlap of enriched dysregulated KEGG pathways (E-MO versus CO-MO, BH-adjusted p < 0.001) between zebrafish head and tail samples. G, Numbers of aberrant splicing events comparing to CO-MO.

