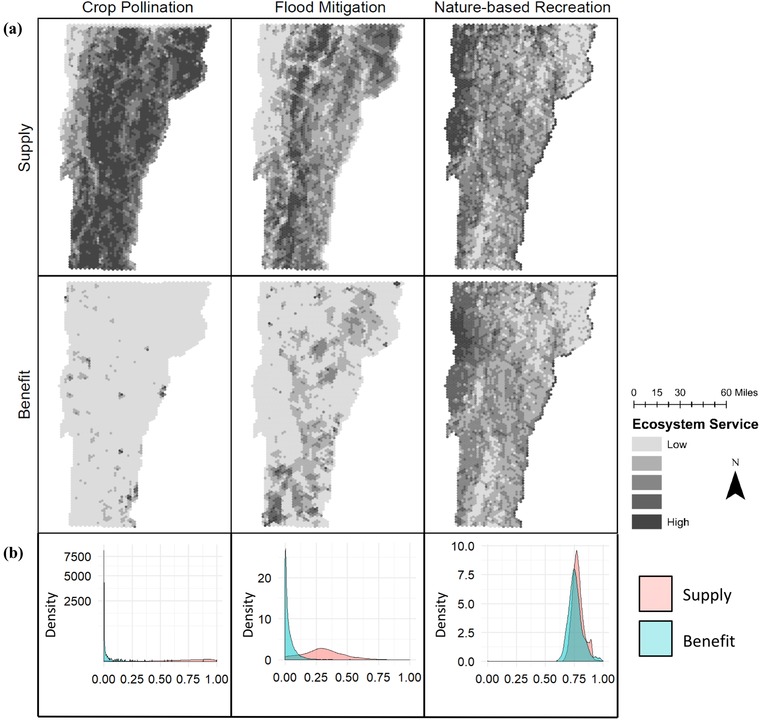
Figure 1.

(a) Spatial and (b) density distribution of ecosystem service supply and benefit for crop pollination, flood mitigation, and nature‐based recreation in Vermont (maps: the darker the shading the higher the level of supply or benefit; 5 shades categorized with the natural breaks function in ArcMap; graphs: density distributions are a smoothed version of a histogram and illustrate the continuous nature of supply and benefit indices; density, relative density of values within a range such that the area under the entire curve equals 1).
