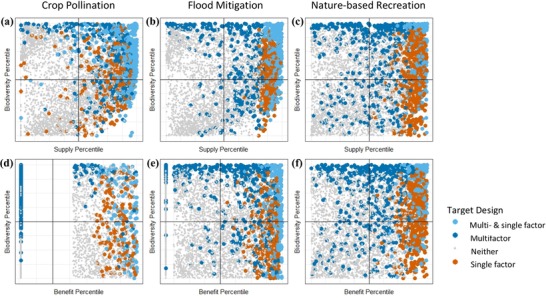
Figure 4.

Return on investment for biodiversity and ecosystem services of units of analysis selected under different optimizations. Panels depict the percentile rank of each hexagon for ecosystem service (supply or benefit) on the x‐axis and biodiversity on the y‐axis (each axis is therefore scaled from 0 to 100) (return on investment, ratio of ecosystem service or biodiversity to conservation cost; top panels, supply; bottom panels, benefit).
