
Figure 1.
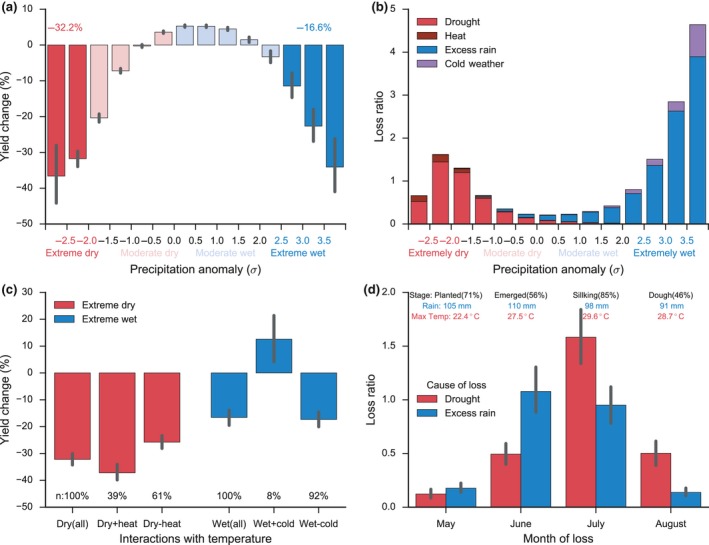
Impacts of extreme drought and excessive rainfall on maize production in the United States from crop yield (a, c) and crop insurance loss data (b, d). (a) Maize yield response to growing season precipitation anomaly from 1981 to 2016. Each bar shows the yield change weighted by harvest area from county samples in the corresponding precipitation range. The percentages shown on top are the averaged impacts of extreme drought (<−2σ, red) and extreme rainfall (>2.5σ, blue) on maize yield. (b) Crop insurance loss ratio for maize from 1989 to 2016 caused by drought, heat, excessive rainfall, and cold weather along precipitation anomaly. (c) Temperature interactions in the extreme drought and excessive rainfall impacts. Extreme drought samples (Dry [all]) are separated into drought with (Dry + heat) and without extreme heat (Dry − heat). Excessive rainfall samples (Rain [all]) are separated into extreme wet with (Rain + cold) and without extreme cold (Rain − cold). The extreme heat (>+2.5σ) and extreme cold (<−2σ) conditions are defined based on standard anomaly of the growing season maximum temperature. The percentage of the separated sample to the total sample is denoted by n. (d) Crop insurance loss ratio caused by drought and excessive rainfall in different months during extreme dry and extreme wet years. Values reported on top are the maize growth stage and its percentage from crop progress report, the monthly climatology of precipitation and max temperature from 1981 to 2016, weighted by harvest area. Error bars in panels a, c, and d denote the 95% confidence interval estimated from 1,000 times of bootstrap