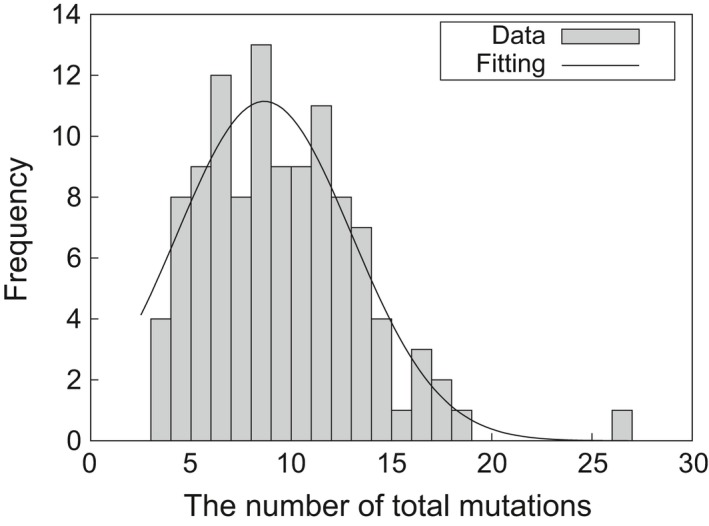
Figure 3.

Distribution and Gaussian fit of the number of mutations per line
The total number of mutations detected for each of 110 M2 lines derived from 150 Gy irradiation of dry seeds. On average 9.06 ± 0.37 (average ± SE) mutations were detected in an unselected M2 line. The solid line indicates goodness of fit to the Gaussian distribution (μ = 8.66, σ = 4.37).
