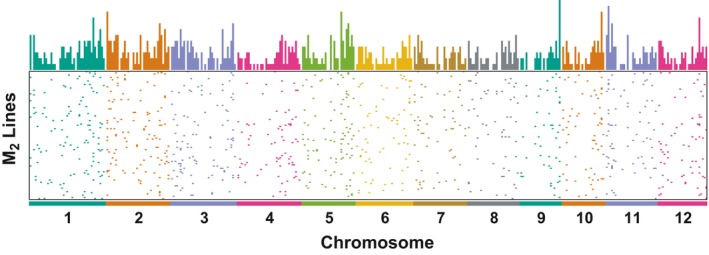
Figure 5.

Chromosomal distribution and frequency of mutations
The chromosomal location of all mutation events detected within the target exon regions for each M2 line derived from 150 Gy irradiation of dry seeds. The relative mutation frequency (per Mbp) is plotted above. The mutations were distributed on all chromosomes. Note that fewer target exon regions were subjected to target‐capture sequencing in the centromeric regions.
