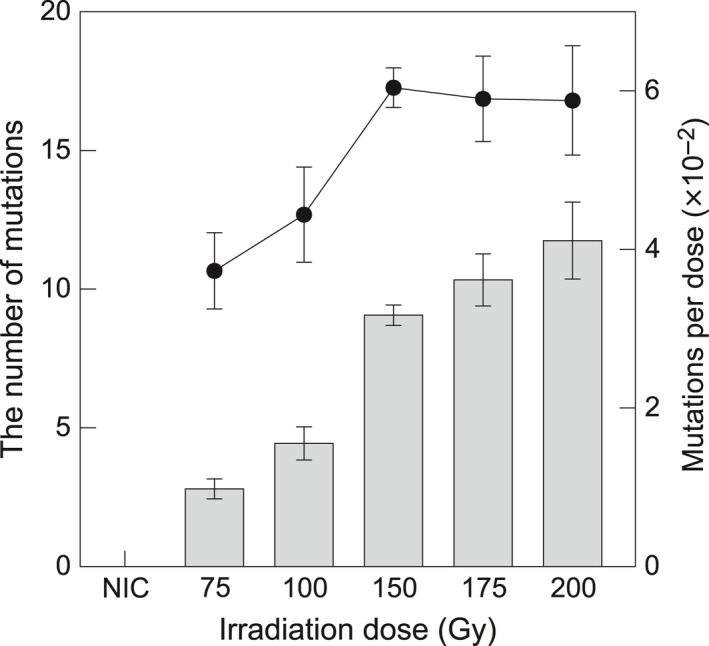
Figure 6.

Number of line‐specific mutations in heavy‐ion‐irradiated, unselected Nipponbare populations
The mean number of line‐specific mutations (bars) for populations subjected to different irradiation doses (15, 75, 100 and 150 Gy), linear energy transfer (30 and 50 keV μm−1), and seed conditions (dry and imbibed seeds). The total number of mutations per irradiation dose is indicated by solid circles. Error bars represent the standard error. NIC, non‐irradiated control.
