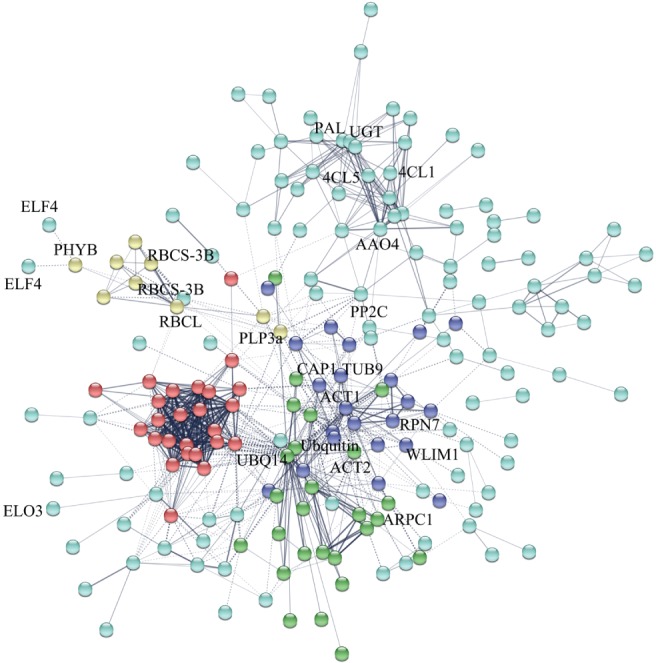
Figure 6.

Protein–protein interaction networks of 378 DEPs in the B. rapa hypocotyl. Nodes of different colors represent proteins. Edges represent protein–protein association. The coarseness of the lines represents interaction strength. Solid lines in the picture indicate protein interaction in intragroup. Dotted lines represent protein interaction between groups.
