
Figure 2.
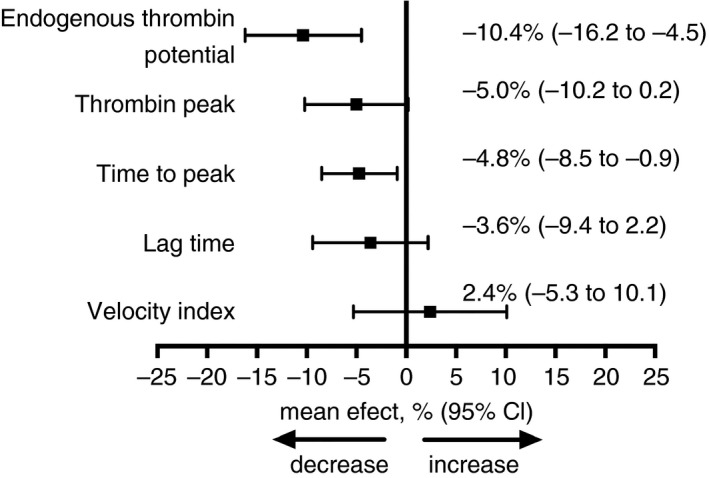
Relative effect of rosuvastatin treatment on thrombin generation. This figure illustrates the changes in endogenous thrombin potential, from baseline to the end of treatment, compared between rosuvastatin users and non‐statin users.
Official websites use .gov
A
.gov website belongs to an official
government organization in the United States.
Secure .gov websites use HTTPS
A lock (
) or https:// means you've safely
connected to the .gov website. Share sensitive
information only on official, secure websites.
Relative effect of rosuvastatin treatment on thrombin generation. This figure illustrates the changes in endogenous thrombin potential, from baseline to the end of treatment, compared between rosuvastatin users and non‐statin users.