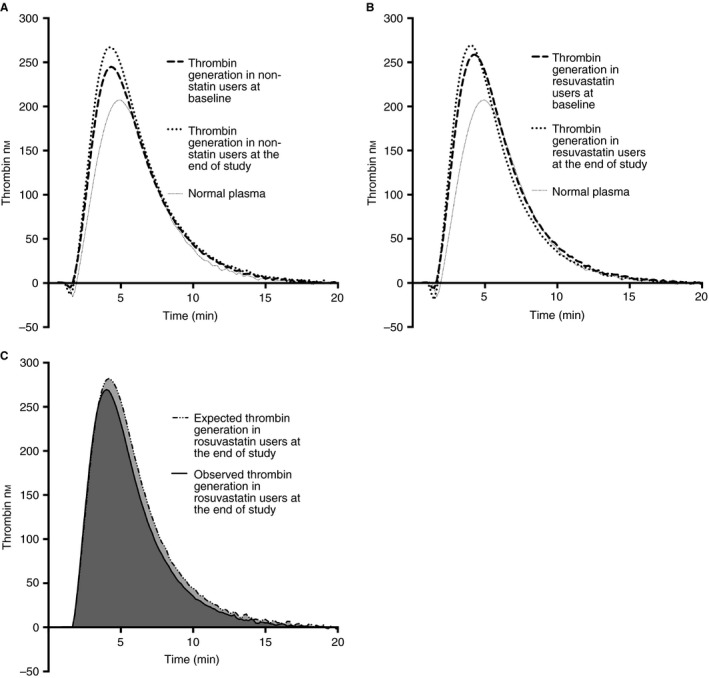
Figure 3.

Thrombin generation curves: (A) mean values of thrombin generation over time in non‐statin users at baseline and at the end of the study, (B) mean values of thrombin generation over time in rosuvastatin users at baseline and at the end of the study, and (C) expected mean thrombin generation values (if rosuvastatin would not have a treatment effect on thrombin generation) and observed mean thrombin generation values by the end of the study in patients receiving rosuvastatin.
