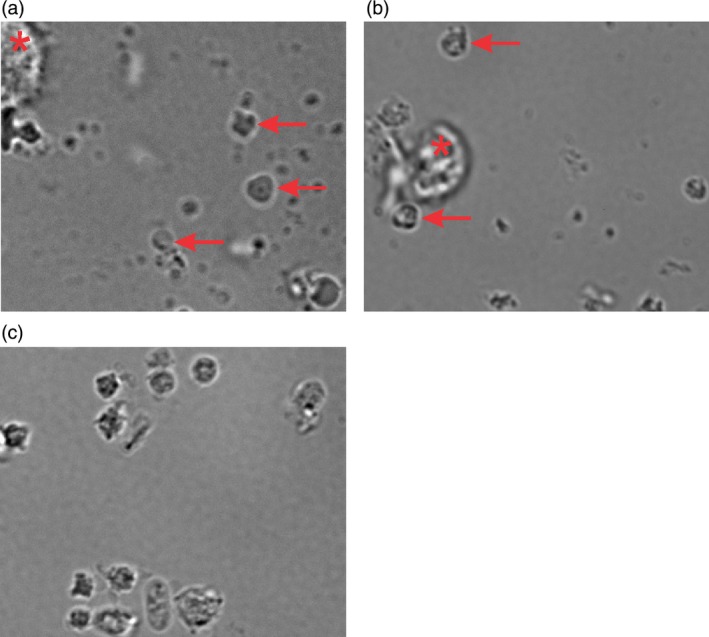
Figure 5.

Differential interference microscopy. Representative images of the cell suspensions from (a) UCB or (b) PB after perfusion and double centrifugation. PLP are indicated by arrows. The larger cells were most likely MK (*). (c) Representative image of bPLT prepared in the same way as the PLP. Pictures were taken from DIC microscopy studies 1000× magnification.
