
Figure 5.
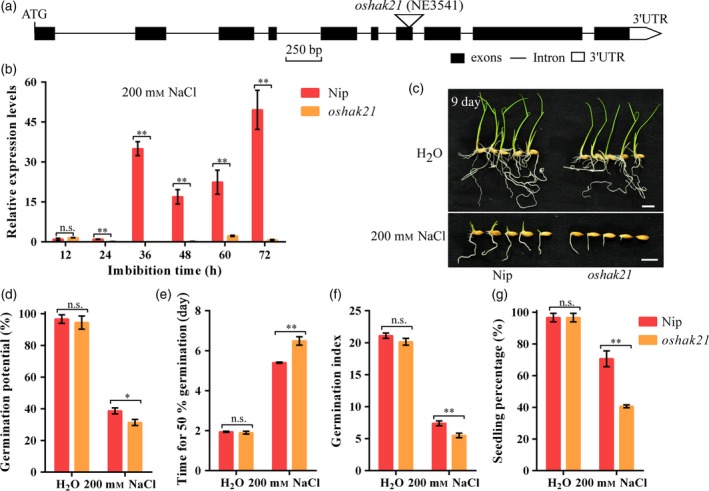
Comparison of seed germination between Nip and oshak21 mutants under normal conditions or salinity stress. (a) Gene structure of OsHAK21 with a T‐DNA insertion. Triangle represents the T‐DNA. Black and white boxes represent exons and the untranslated region (UTR) of OsHAK21, respectively. Solid lines represent introns. (b) qRT‐PCR analysis of OsHAK21 in germinating seeds of Nip and oshak21 under salinity stress. Gene expression was normalized to that of OsActin gene control. The relative expression levels were represented by fold change relative to the expression level of Nip at the 12 h imbibition stage. (c) Seed germination after 9 days under normal conditions or salinity stress. Bars = 10 mm. (d) Germination potential; (e) time for 50% of the germination percentage; (f) germination index; (g) seedling percentage. Each column represents the means ± SD. * and ** Indicate significant difference at 5% and 1% levels according to Student's t‐test, respectively. n.s. Results not significant.