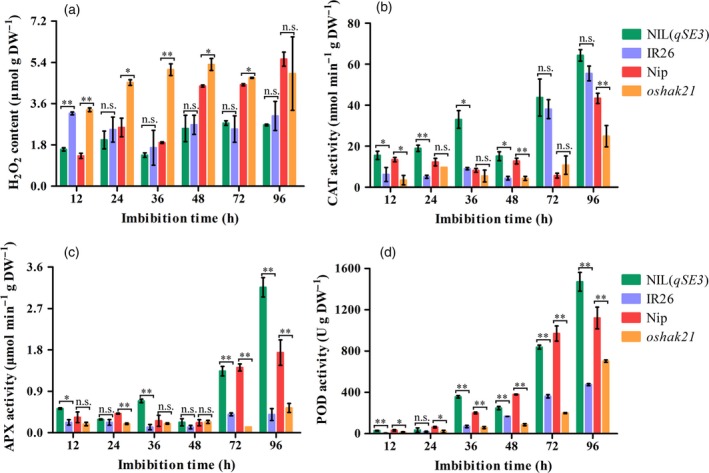
Figure 8.

Comparison of H2O2 levels and antioxidant enzymes activities between NIL(qSE3) and IR26 and between Nip and oshak21 in germinating seeds under salinity stress. (a) H2O2 content; (b) CAT activity; (c) APX activity; (d) POD activity. Each column represents the means ± SD. * and ** Indicate the significant difference at 5% and 1% levels according to Student's t‐test, respectively. n.s. Results not significant.
