
Figure 10.
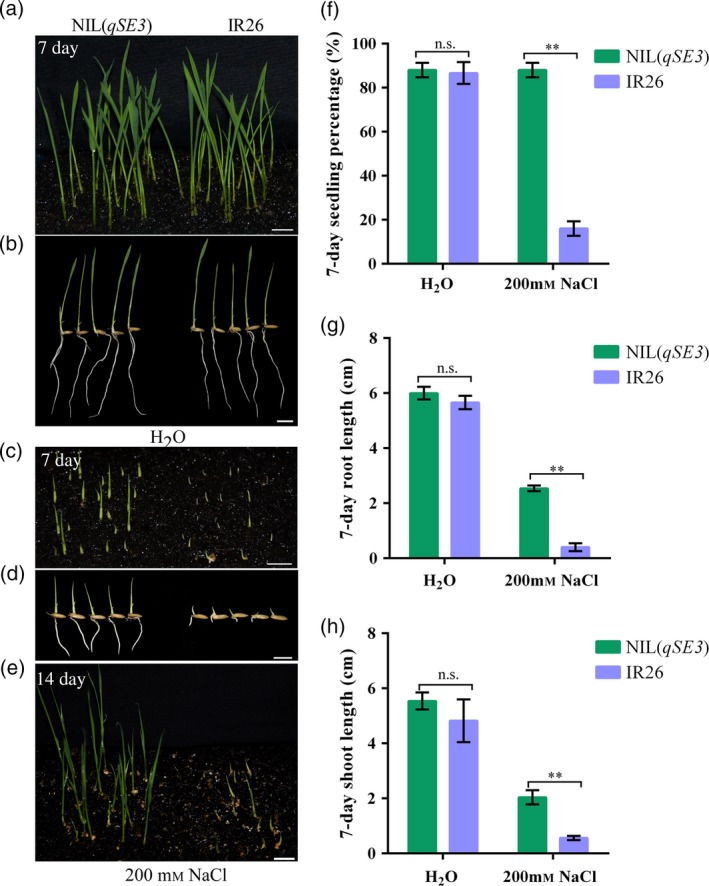
Comparison of seedling establishment and seedling growth between NIL(qSE3) and IR26 when seeds are directly sown in soil. Seedling establishment and seedling growth under normal conditions (a, b) or salinity stress (c, d) at 7 days after sowing. (e) Seedling survival under salinity stress at 14 days after sowing. Bars = 10 mm. (f) Seedling percentage; (g) root length; (h) shoot length. Each column represents the means ± SD. **Indicates the significant difference at 1% level according to Student's t‐test. n.s. Results not significant.