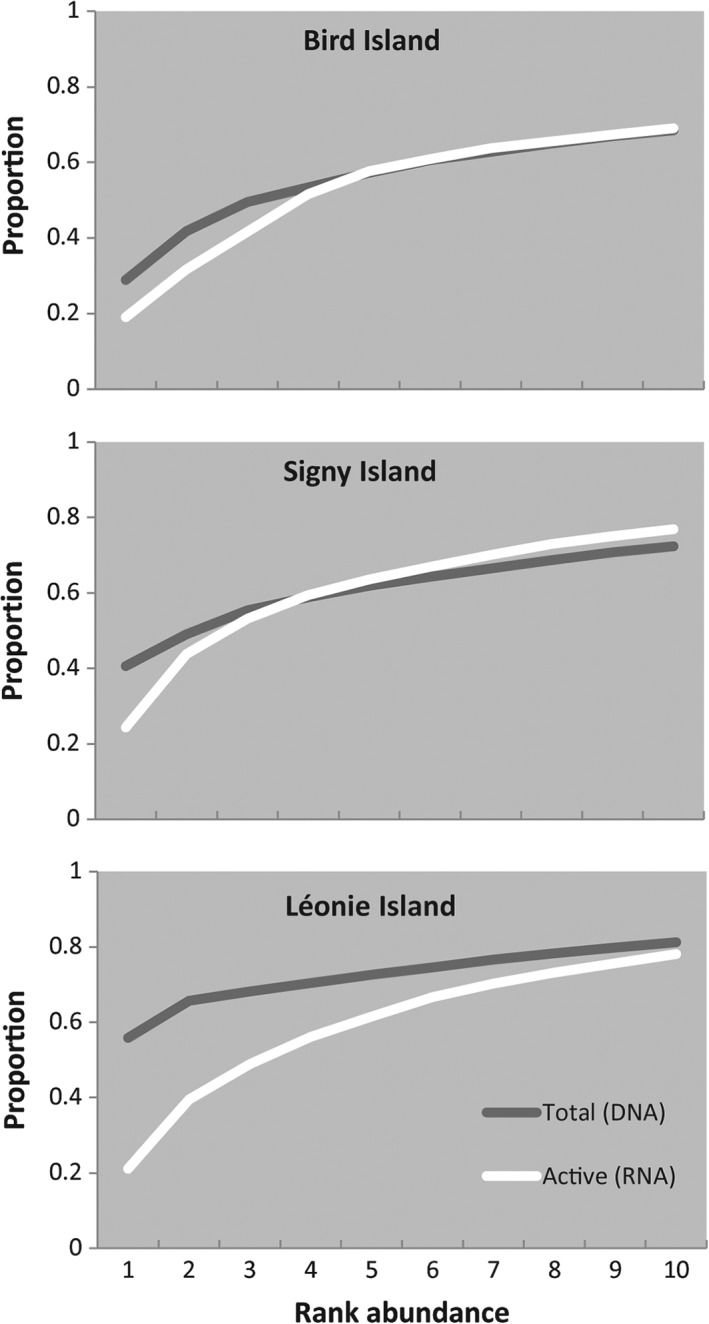
Figure 5.

K‐dominance plots of total and active soil fungi communities at the three Antarctic islands. The cumulative proportion of the overall community made up by the 10 most abundant OTUs on each island are shown, to illustrate the lower abundance of the dominant fungi in the active communities.
