Figure 2.

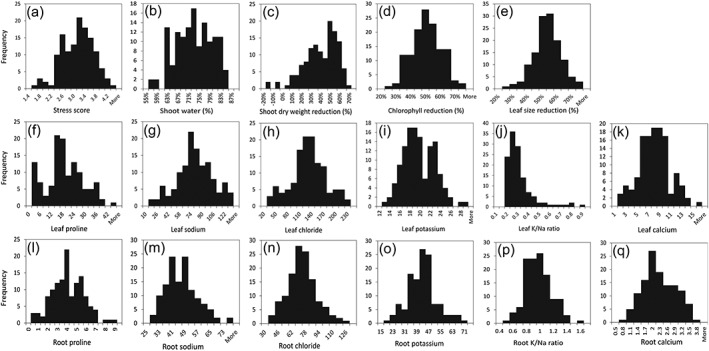
Distribution of salinity stress‐related traits in a collection of 132 M. truncatula lines/ecotypes. Traits are indicated on the x‐axis and number of lines on the y‐axis

Distribution of salinity stress‐related traits in a collection of 132 M. truncatula lines/ecotypes. Traits are indicated on the x‐axis and number of lines on the y‐axis