Figure 4.

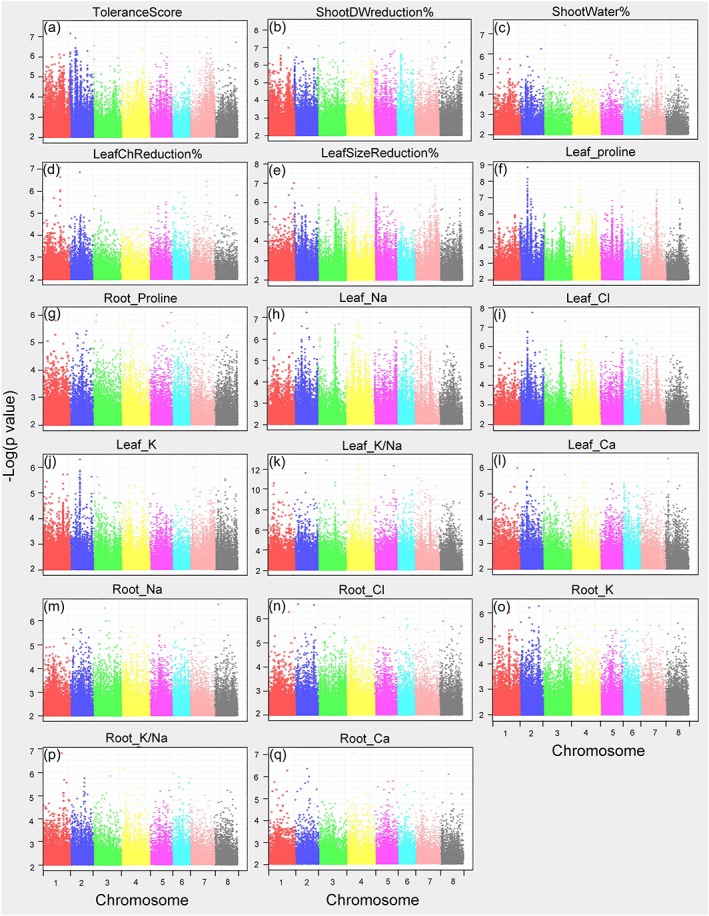
Manhattan plots (mixed linear model) of mapped single nucleotide polymorphisms (SNP) markers associating with each trait. Only SNPs with P values smaller than 0.01 are plotted

Manhattan plots (mixed linear model) of mapped single nucleotide polymorphisms (SNP) markers associating with each trait. Only SNPs with P values smaller than 0.01 are plotted