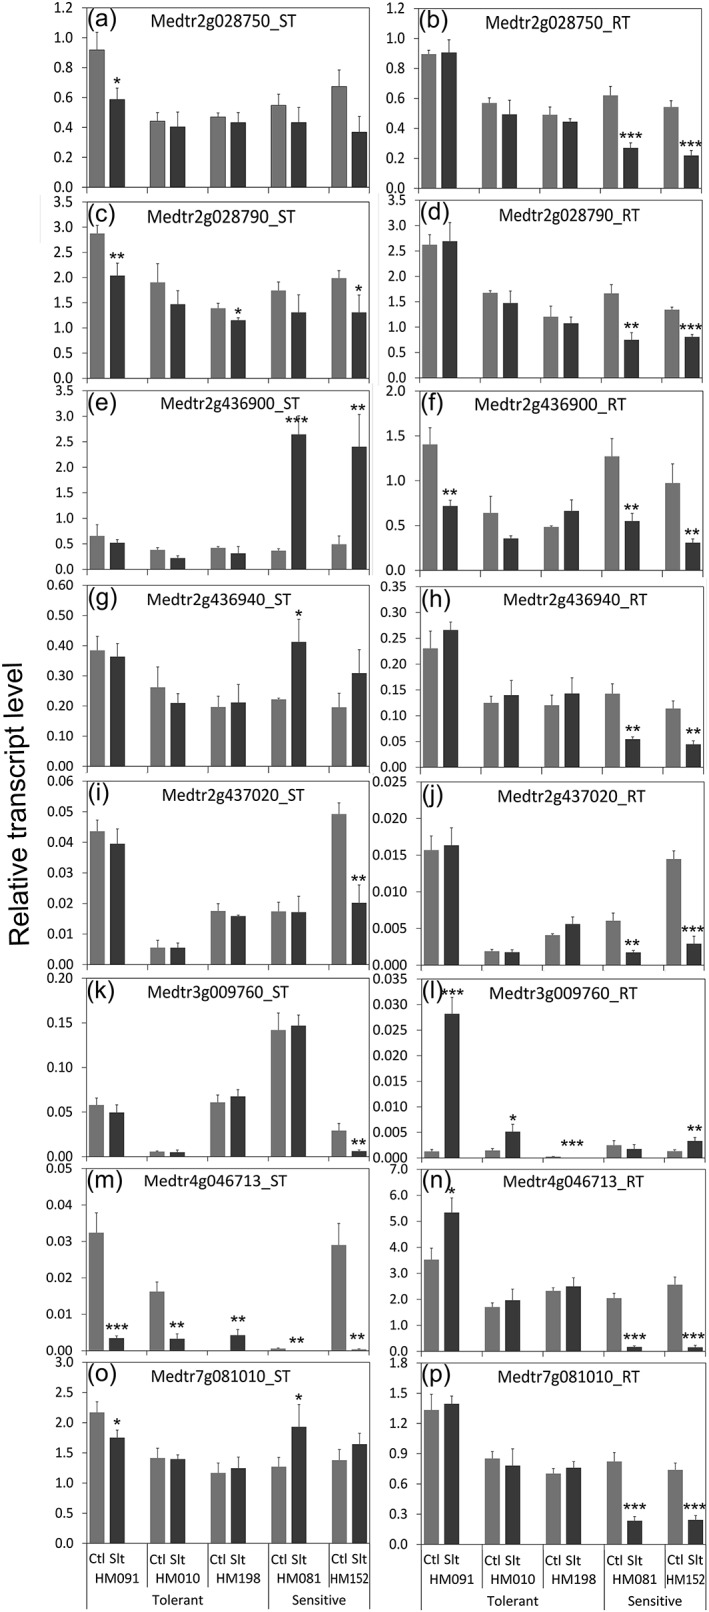
Figure 9.

Transcript levels of potential causative genes in tolerant and sensitive genotypes. Relative transcript levels were determined by qRT‐PCR. The tolerance scores for HM091, HM010, HM198, HM081, and HM152 were 4.2, 3.8, 3.5, 1.7, and 1.5, respectively. Transcript levels are expressed relative to the mean of three housekeeping genes (Ubiquitin‐Conjugating enzyme E2, Polypyrimidine Tract‐Binding protein and Ubiquitin). n = 3. Error bars represent standard errors. Significance tests were between control and salinity stress treatments only in each genotype. Significat differences at *P < 0.05, **P < 0.01, and ***P < 0.001. Ctl: control. Salt: salinity‐treated
