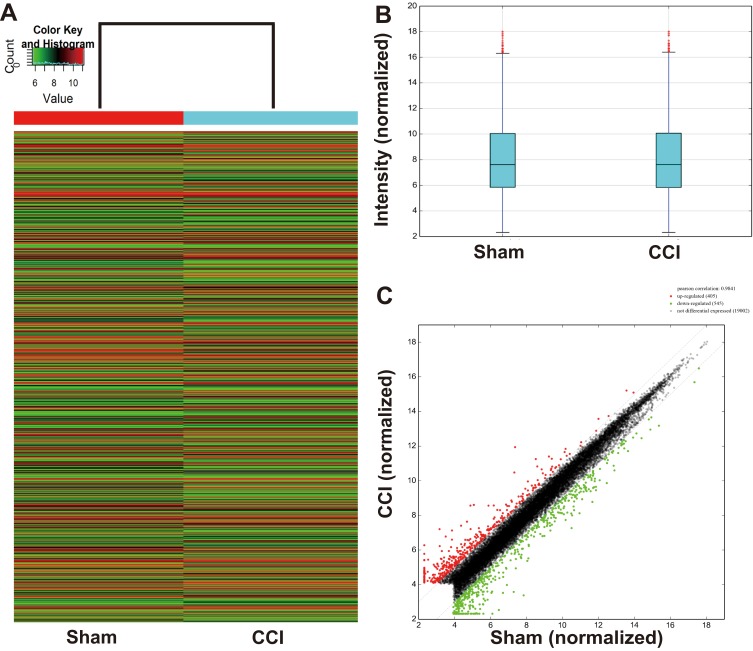
Figure 2.
mRNA expression between the CCI and sham-operated rats. (A) Hierarchical clustering shows a differential mRNA expression profiles between two groups. The upregulated mRNAs in the CCI group are shown in red, and the downregulated ones are in green. (B) Box plots show the distribution of mRNAs for the two groups. The distributions (the means, the 25th and 75th percentiles) were nearly the same in the CCI and Sham groups after normalization, indicating that the overall expression of mRNA was uniform between the two groups. (C) Scatter plots assess the mRNA expression differences between CCI and Sham groups. The mRNAs above the top green line (indicated with red dot) and below the bottom green line (indicated with green dot) are differential mRNAs (fold change ≥ 2.0 or ≤ −2.0, respectively), while mRNAs with no expression difference are represented with black dots between the two border lines.

