
. 2019 Nov 8;12:3025–3035. doi: 10.2147/JPR.S217866
© 2019 Ng et al.
This work is published and licensed by Dove Medical Press Limited. The full terms of this license are available at https://www.dovepress.com/terms.php and incorporate the Creative Commons Attribution – Non Commercial (unported, v3.0) License (http://creativecommons.org/licenses/by-nc/3.0/). By accessing the work you hereby accept the Terms. Non-commercial uses of the work are permitted without any further permission from Dove Medical Press Limited, provided the work is properly attributed. For permission for commercial use of this work, please see paragraphs 4.2 and 5 of our Terms (https://www.dovepress.com/terms.php).
Figure 3.
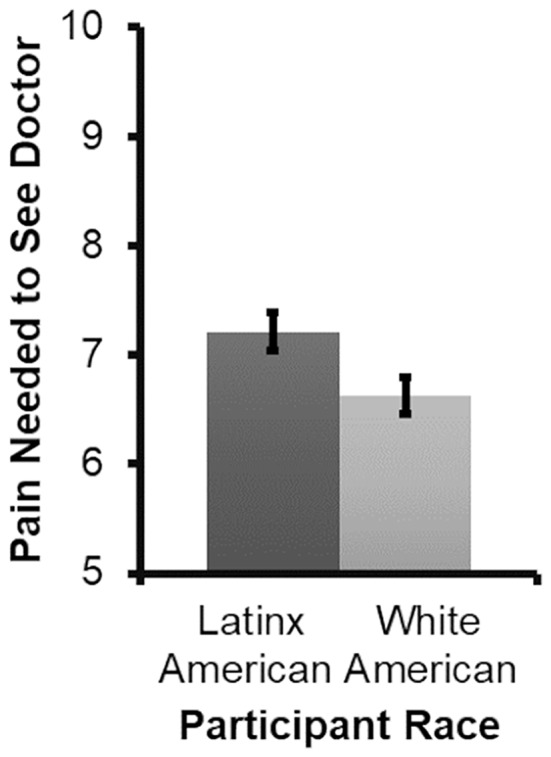
Group differences in pain treatment seeking. Error bars represent standard error of the mean (SEM) for each cell.