
Figure 1.
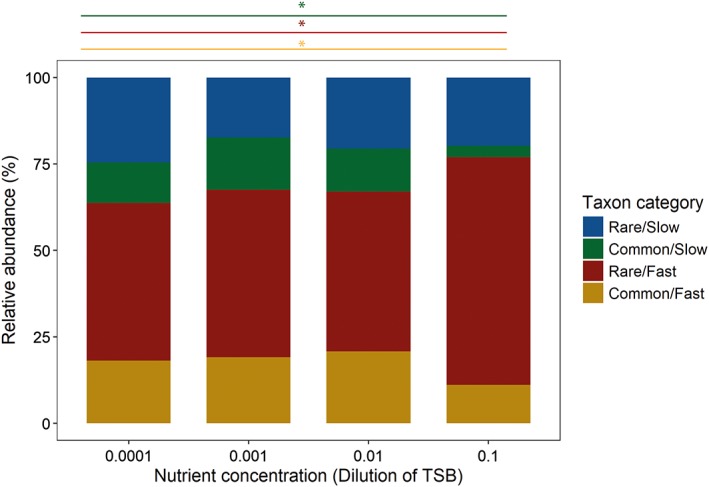
Average relative abundance of the four bacterial taxon categories at different nutrient concentrations; relative abundances are averaged over predation treatments and communities; significant linear relationships of abundance with nutrient concentration are indicated with a coloured line for the relevant taxon categories and an *.